Running Palace Simulations: Microstrip#
Palace is an open-source 3D electromagnetic simulator supporting eigenmode, driven (S-parameter), and electrostatic simulations. This notebook demonstrates using the gsim.palace API to run a driven simulation on a microstrip transmission line with via ports.
Requirements:
IHP PDK:
uv pip install ihp-gdsfactoryGDSFactory Simulation SDK:
uv pip install gsimGDSFactory+ account for cloud simulation
Load a pcell from IHP PDK#
import gdsfactory as gf
from ihp import LAYER, PDK, cells
PDK.activate()
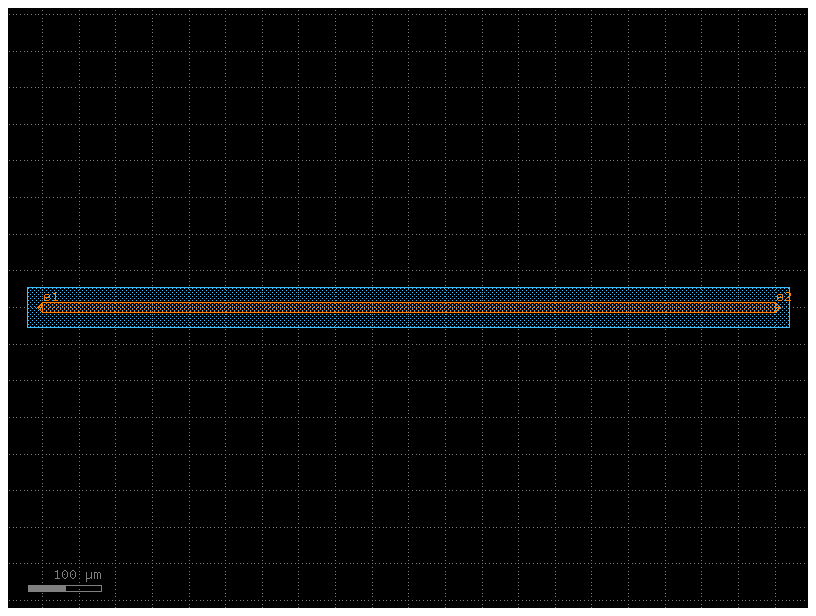
c = gf.Component()
r1 = c << cells.straight_metal(length=1000, width=14)
r = c.get_region(layer=LAYER.TopMetal2drawing)
r_sized = r.sized(+20000)
c.add_polygon(r_sized, layer=LAYER.Metal1drawing)
c.add_ports(r1.ports)
cc = c.copy()
cc.draw_ports()
cc
Configure and run simulation with DrivenSim#
from gsim.palace import DrivenSim

# Create simulation object
sim = DrivenSim()

# Set output directory
sim.set_output_dir("./palace-sim-microstrip")

# Set the component geometry
sim.set_geometry(c)

# Configure layer stack from active PDK
sim.set_stack(substrate_thickness=2.0, air_above=300.0)

# Configure via ports (Metal1 ground plane to TopMetal2 signal)
for port in c.ports:
    sim.add_port(port.name, from_layer="metal1", to_layer="topmetal2", geometry="via")

# Configure driven simulation (frequency sweep for S-parameters)
sim.set_driven(fmin=1e9, fmax=100e9, num_points=300)

# Validate configuration
print(sim.validate_config())
Validation: PASSED
# Generate mesh (presets: "coarse", "default", "fine")
sim.mesh(preset="default")
Warning : 7 ill-shaped tets are still in the mesh
Warning : ------------------------------
Warning : Mesh generation error summary
Warning :     1 warning
Warning :     0 errors
Warning : Check the full log for details
Warning : ------------------------------
Mesh Summary
========================================
Dimensions: 1140.0 x 154.0 x 318.3 µm
Nodes: 6,216
Elements: 46,902
Tetrahedra: 33,262
Edge length: 0.40 - 285.00 µm
Quality: 0.391 (min: 0.001)
SICN: 0.430 (all valid)
----------------------------------------
Volumes (3):
- SiO2 [1]
- passive [2]
- air [3]
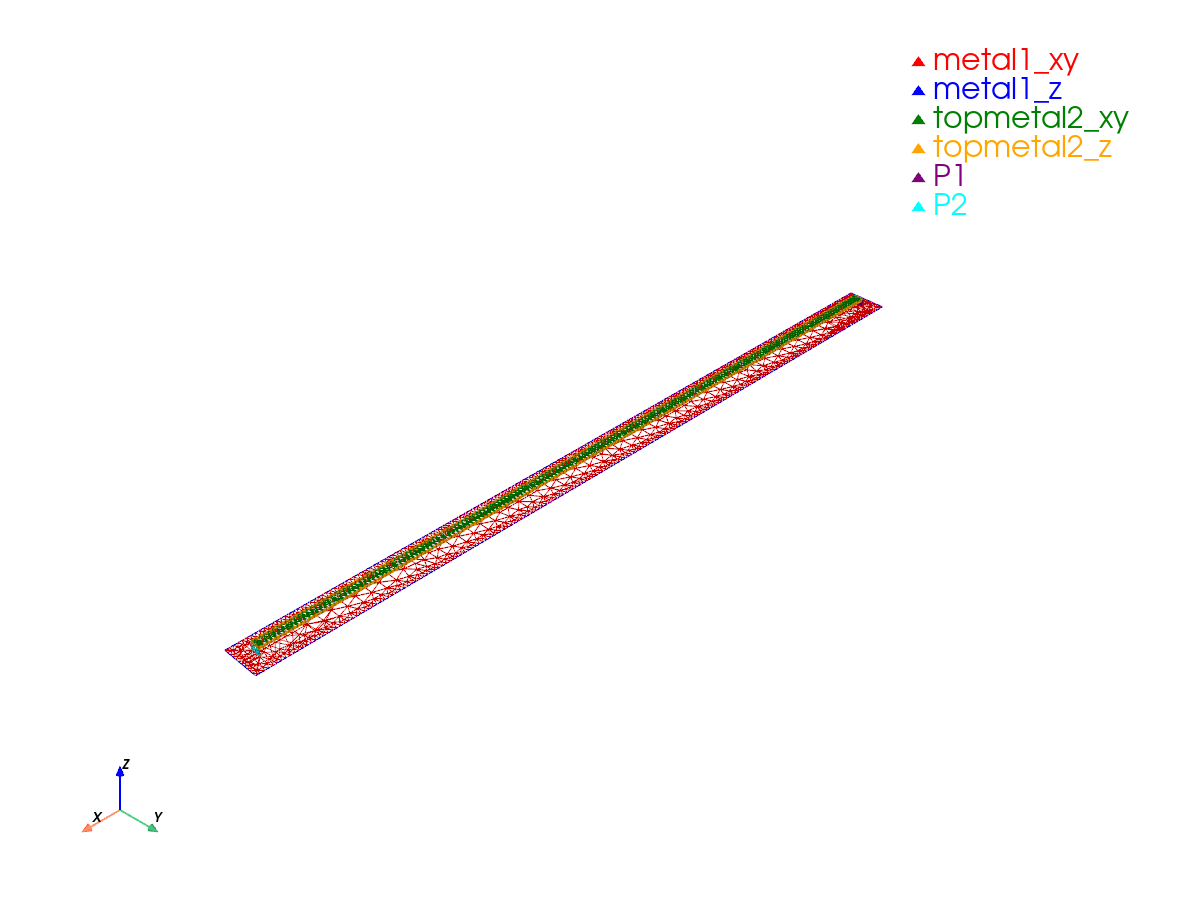
Surfaces (11):
- metal1_xy [4]
- metal1_z [5]
- topmetal2_xy [6]
- topmetal2_z [7]
- P1 [8]
- P2 [9]
- SiO2__None [10]
- SiO2__passive [11]
- passive__None [12]
- air__passive [13]
- air__None [14]
----------------------------------------
Mesh: palace-sim-microstrip/palace.msh
# Static PNG
sim.plot_mesh(show_groups=["metal", "P"])
2026-04-12 11:36:14.349 (   3.358s) [    7FE8FB754B80]vtkXOpenGLRenderWindow.:1460  WARN| bad X server connection. DISPLAY=
2026-04-12 11:36:14.349 (   3.359s) [    7FE8FB754B80]vtkOpenGLRenderWindow.c:645   WARN| Failed to load EGL! Please install the EGL library from your distribution's package manager.
2026-04-12 11:36:15.452 (   4.462s) [    7FE8FB754B80]vtkOpenGLRenderWindow.c:645   WARN| Failed to load EGL! Please install the EGL library from your distribution's package manager.
/home/runner/work/IHP/IHP/.venv/lib/python3.12/site-packages/gsim/viz.py:261: UserWarning: Failed to use notebook backend:

Please install `nest_asyncio2` to automagically launch the trame server without await. Or, to avoid `nest_asyncio2` run:

from pyvista.trame.jupyter import launch_server
await launch_server().ready

Falling back to a static output.
  plotter.show()
Run simulation on GDSFactory+ Cloud#
# Run simulation on GDSFactory+ cloud
results = sim.run()
palace-bf856b2c completed 4m 02s
Extracting results.tar.gz...
Downloaded 10 files to /home/runner/work/IHP/IHP/docs/sim-data-palace-bf856b2c
results.plot_interactive()
Port mapping: Port 1: e1, Port 2: e2
results.plot_interactive(phase=True)
Port mapping: Port 1: e1, Port 2: e2