Schematic driven layout
A schematic is a graph representation of your circuit.
For complex circuits, a schematic allows you to create symbols and hierarchy levels to represent your circuit.
Having a schematic allows you to also ensure that your layout matches you schematic (design intent).
There are many schematic capturing tools out there:
- Qucs-s: for RF.
- Xschem: for analog circuits.
- Lumerical interconnect: for photonic circuits.
These tools allow you to create schematics with either your mouse or by code.
gdsfactory also allows you to create complex Schematics directly from python with a very simple interface.
import gdsfactory as gf
import yaml
from functools import partial

gf.gpdk.PDK.activate()
@gf.schematic_cell
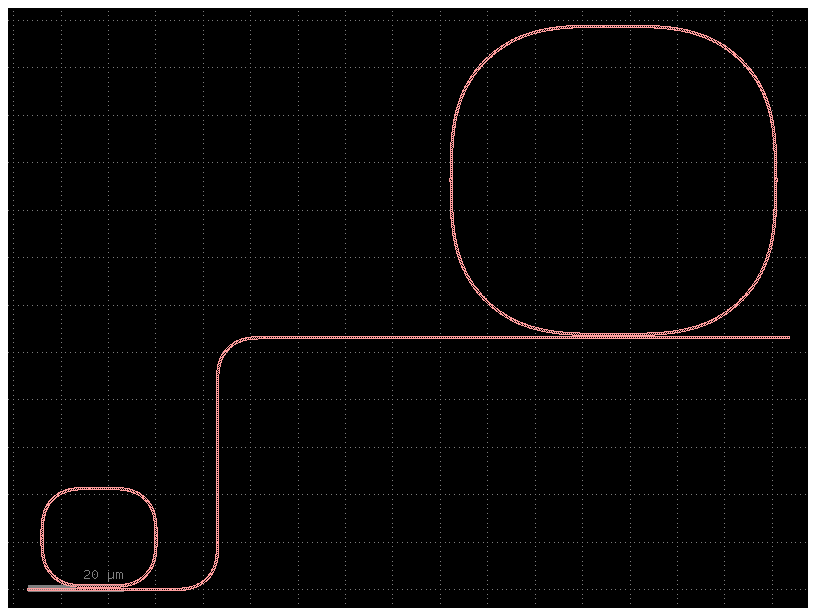
def my_schematic(x: float = 108.5, y: float = 53.1) -> gf.Schematic:
    """Returns a schematic with two rings connected by a waveguide."""
    s = gf.Schematic()
    r1 = s.create_inst(name="r1", component="ring_single")
    r1.place(x=0, y=0)

    r2 = s.create_inst(name="r2", component="ring_single", settings={"radius": 32.2})
    r2.place(x=x, y=y)

    s.add_route(
        name="r1-r2",
        nets=[[r1.ports["o2"], r2.ports["o1"]]],
        routing_strategy="route_bundle",
        settings={},
    )
    return s

c = my_schematic()
c.plot()
@gf.schematic_cell(
    factories=gf.get_factories.get_cells("gdsfactory"),
    routing_strategies=gf.get_active_pdk().routing_strategies
    or {
        "route_bundle": partial(
            gf.routing.route_bundle, layer=gf.get_layer((1, 0)), route_width=1
        )
    },
)
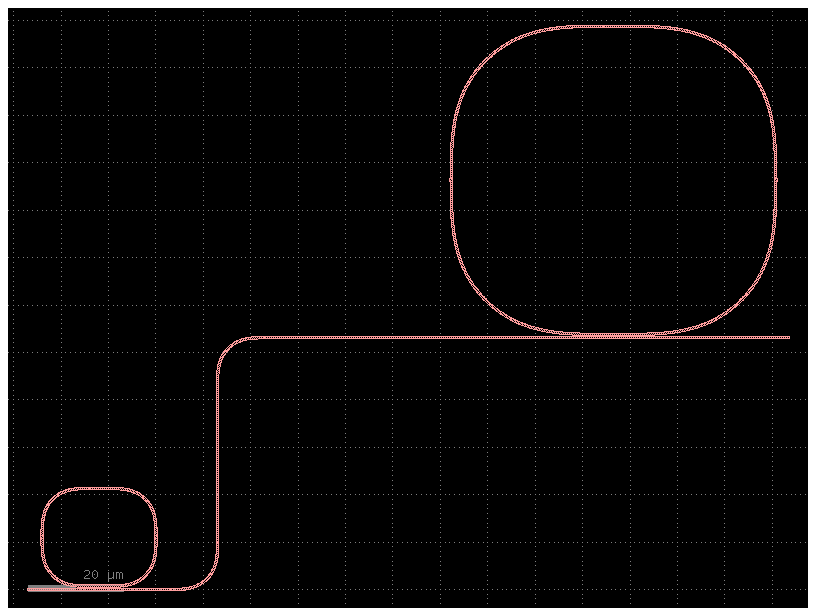
def my_schematic(x: float = 108.5, y: float = 53.1) -> gf.Schematic:
    """Returns a schematic with two rings connected by a waveguide."""
    s = gf.Schematic()
    r1 = s.create_inst(name="r1", component="ring_single")
    r1.place(x=0, y=0)

    r2 = s.create_inst(name="r2", component="ring_single", settings={"radius": 32.2})
    r2.place(x=x, y=y)

    s.add_route(
        name="r1-r2",
        nets=[[r1.ports["o2"], r2.ports["o1"]]],
        routing_strategy="route_bundle",
        settings={},
    )

    return s

c = my_schematic()
c.plot()
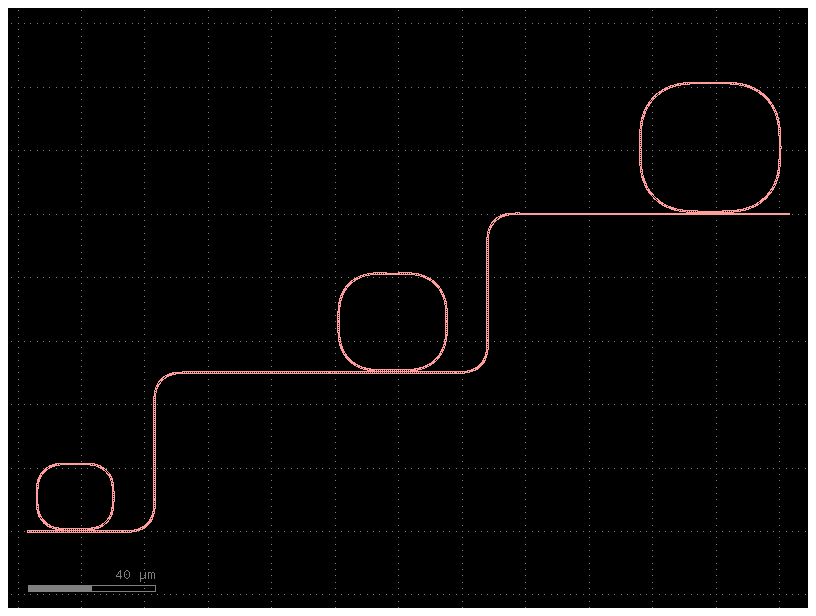
@gf.schematic_cell
def ring_array(n: int = 3, pitch_x: float = 100, pitch_y=50, radius: float = 10, radius_delta: float = 5) -> gf.Schematic:
    """Returns a schematic with n rings connected by a waveguide."""
    s = gf.Schematic()

    last_ring  = None

    for i in range(n):
        r = s.create_inst(name=f"r{i}", component="ring_single", settings={"radius": radius+i*radius_delta})
        r.place(x=i*pitch_x, y=i*pitch_y)
        if last_ring is not None:
            s.add_route(
                name=f"r{i-1}-r{i}",
                nets=[[last_ring.ports["o2"], r.ports["o1"]]],
                routing_strategy="route_bundle",
                settings={},
            )
        last_ring = r
    return s

c = ring_array()
c.plot()
c = gf.c.mzi()

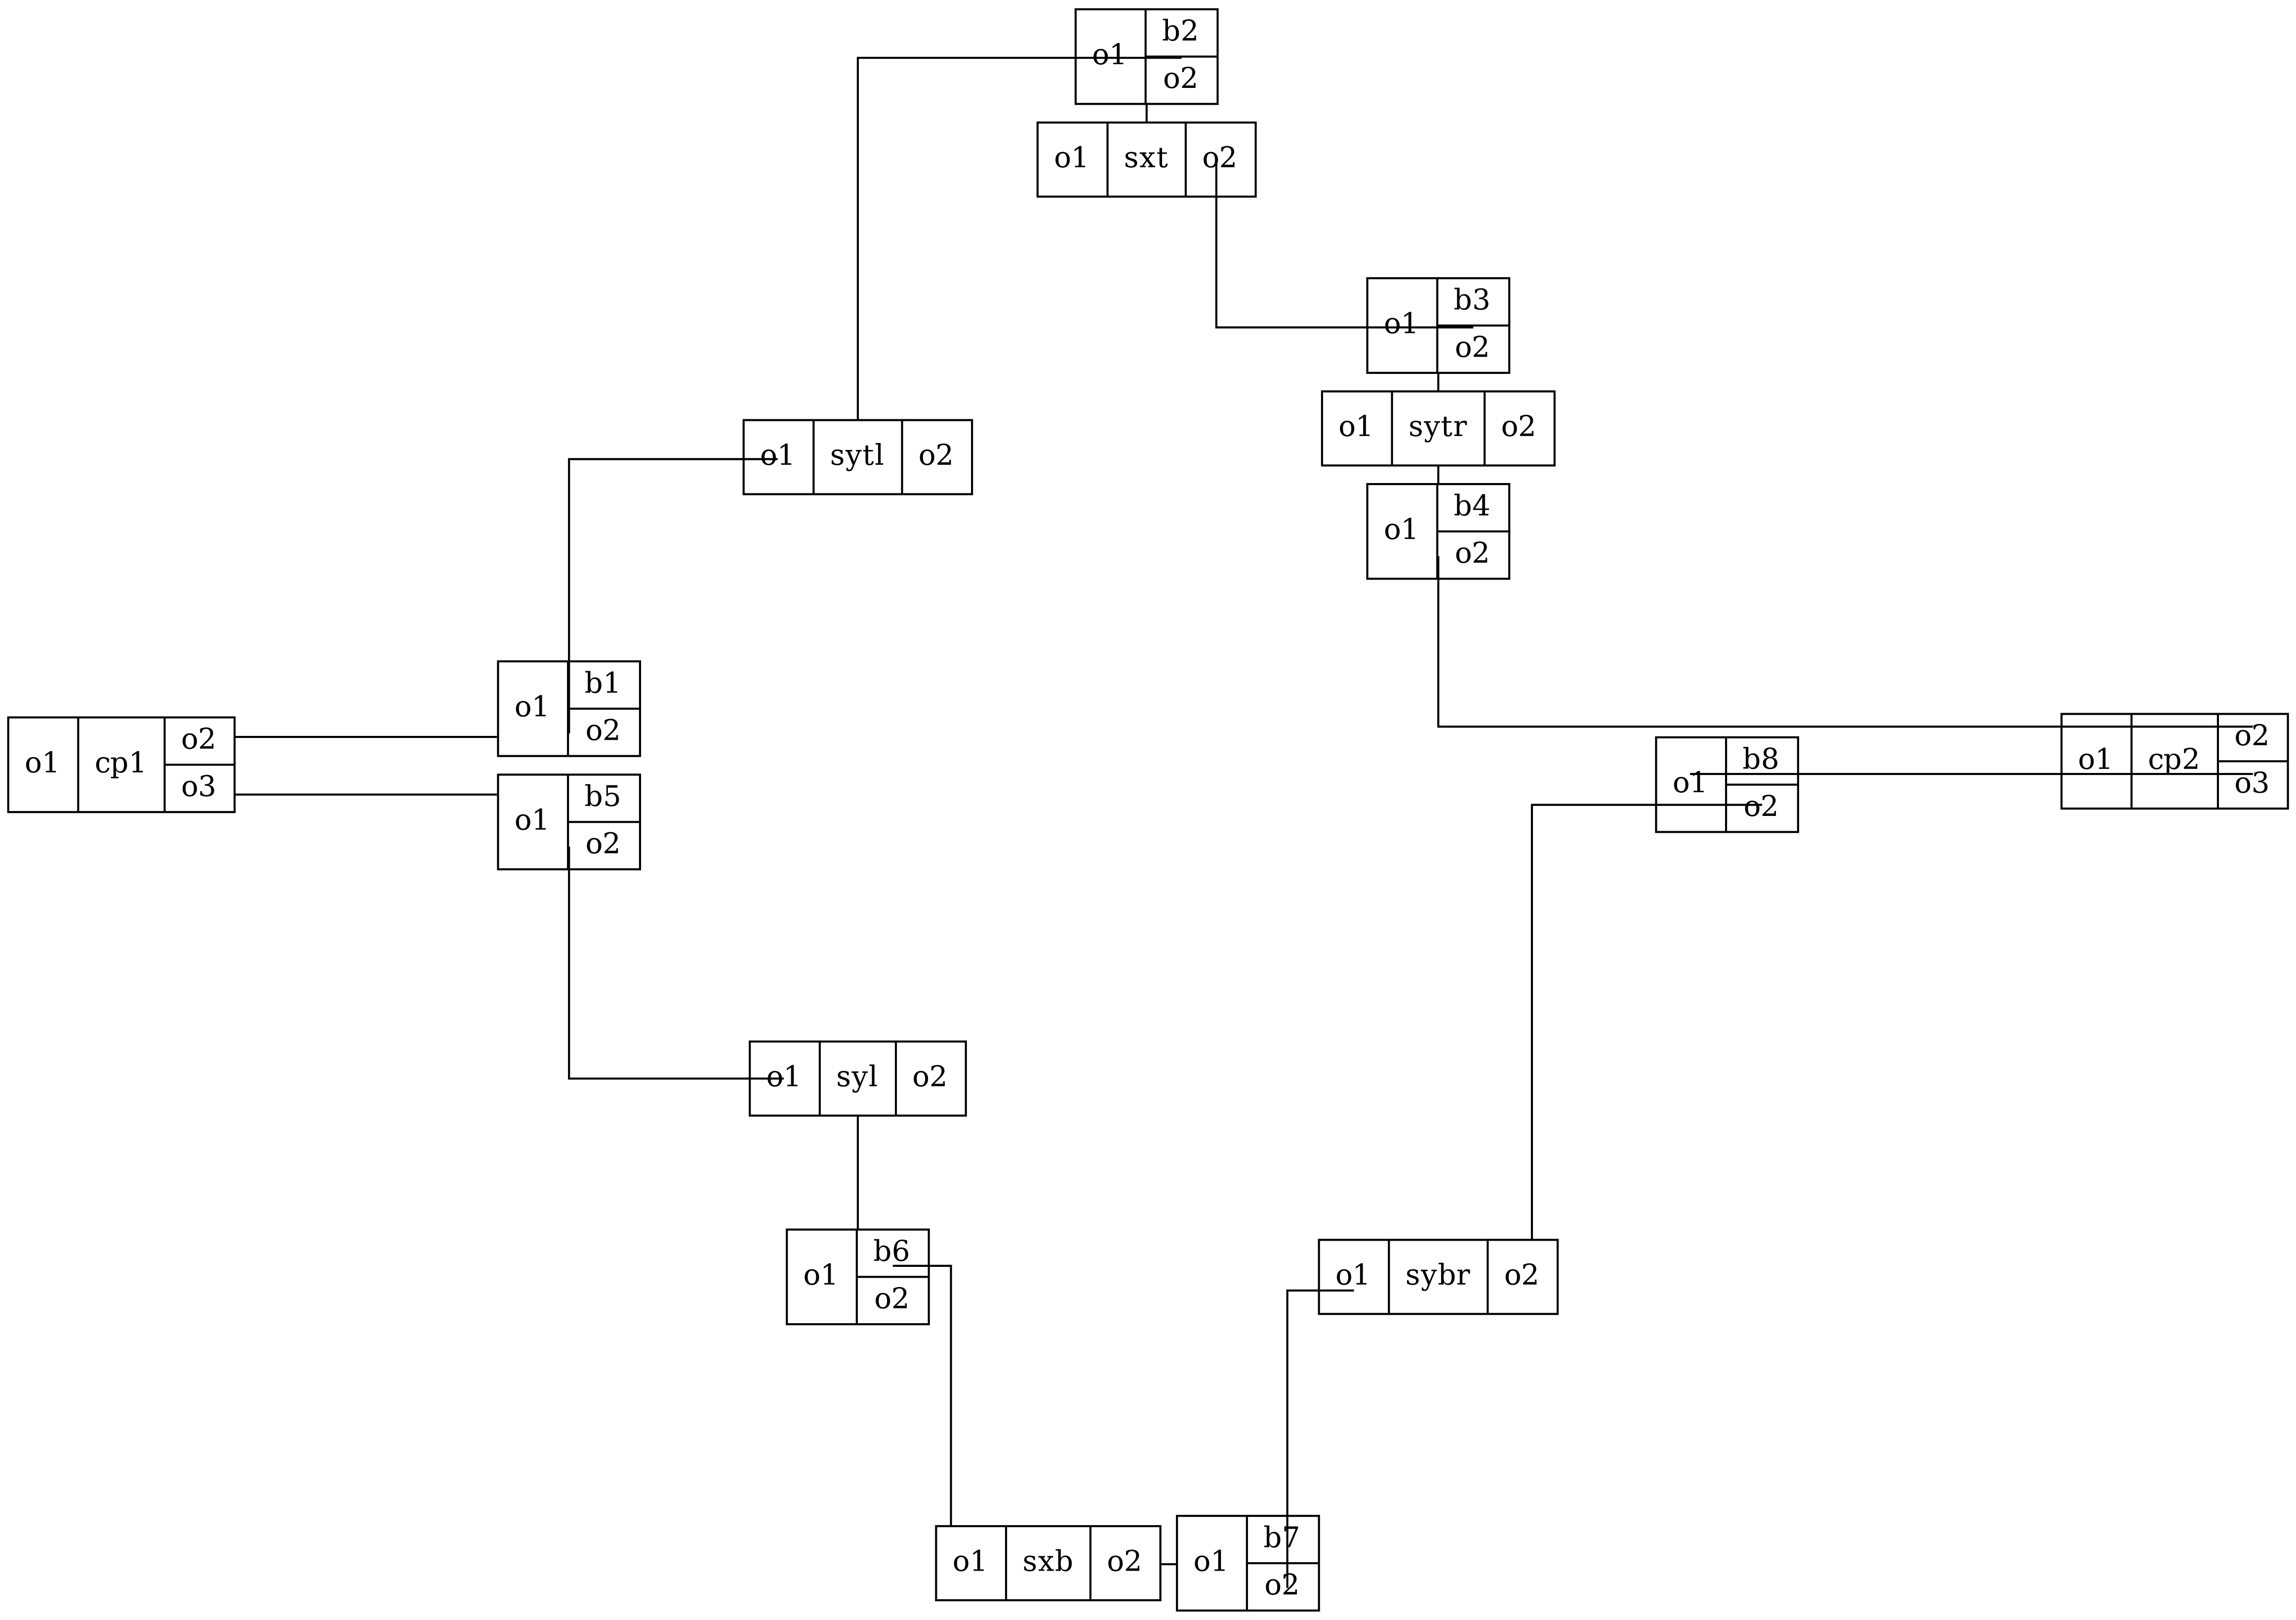
# .plot_netlist_graphviz(): This method reads the component's netlist and uses Graphviz (a graph visualization tool) to create a block diagram.
# interactive=False: This parameter specifies that the output should be a static image rather than an interactive plot.
c.plot_netlist_graphviz(interactive=False)
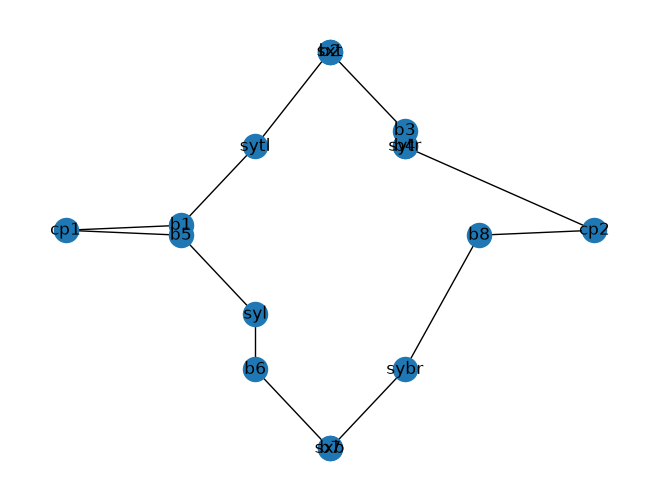
c.plot_netlist()
<networkx.classes.graph.Graph at 0x7f81be2911c0>
Lets create a MZI lattice of 3 elements.
from kfactory.schematic import RegularArray
import gdsfactory as gf

@gf.cell
def splitter_tree_with_new_ports(**kwargs) -> gf.Component:
    """Returns a splitter tree with new ports."""
    c = gf.c.splitter_tree(**kwargs).copy()
    c.auto_rename_ports()
    return c


pdk = gf.get_active_pdk()
pdk.register_cells(splitter_tree_new_ports=splitter_tree_with_new_ports)


@gf.schematic_cell(overwrite_existing=True) # for development
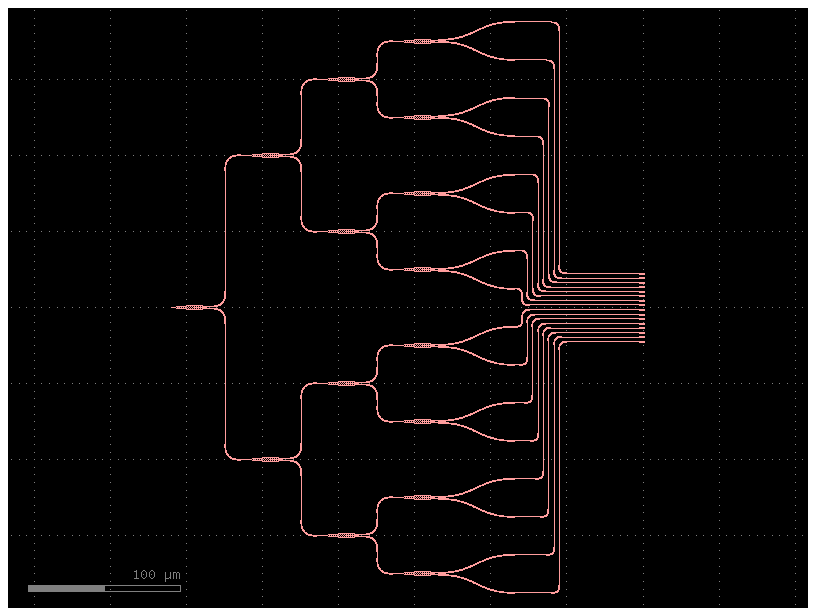
def lidar(n: int = 2**3, dbr_pitch: float = 3) -> gf.Schematic:
    """Returns a schematic with lidar array by a waveguide."""
    s = gf.Schematic()
    spt = s.create_inst(name="splitter", component='splitter_tree_new_ports', settings={'noutputs': n, 'spacing': (50, 50)})
    dbr = s.create_inst(name="dbr", component='dbr', array=RegularArray(rows=n, column_pitch=0, row_pitch=dbr_pitch))
    spt.place(x=0, y=0)
    dbr.place(x=250+n*dbr_pitch, y=-n*dbr_pitch/2+dbr_pitch/2)

    start_ports = [spt.ports[f"o{i+2}"] for i in range(n)]
    end_ports = [dbr.ports["o1", 0, i] for i in range(n)]

    s.add_route(
            name="splitter_to_dbr",
            nets=[[start_ports[i], end_ports[i]] for i in range(n)],
            routing_strategy="route_bundle",
            settings={"radius": 5, "separation": 3, "sort_ports": True},
        )
    return s

c = lidar(n=2**4)
c.plot()