Running Palace Simulations
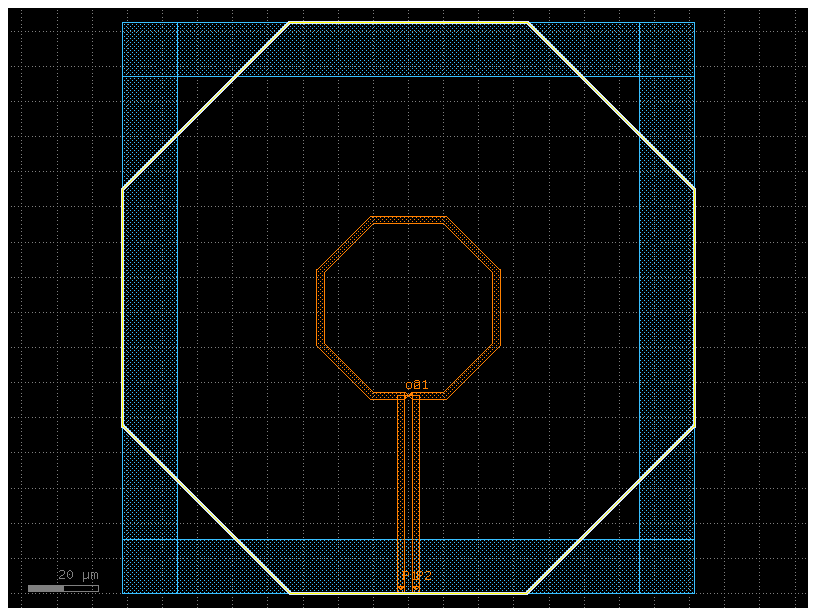
Palace is an open-source 3D electromagnetic simulator supporting eigenmode, driven (S-parameter), and electrostatic simulations. This notebook demonstrates using the gsim.palace API to run a driven simulation on a spiral inductor with Metal1 guard ring, and fitting the resulting S-parameters to an RLC equivalent circuit model for use in circulax.
Requirements:
- Notebook dependencies: uv sync --group palace-inductor
- gsim with Palace backend
Build inductor + guard ring
Known PDK limitation: gf.components.inductor accepts a turns parameter but does not use it in geometry construction. The spiral is always single-turn regardless of the value passed.
import gdsfactory as gf
from ihp import PDK

PDK.activate()

c = gf.components.inductor(
    width=2,
    space=2.1,
    diameter=50,
    turns=1,
    layer_metal="TopMetal2drawing",
    layer_inductor="INDdrawing",
    layer_metal_pin="TopMetal2drawing",
    layers_no_fill=("NoMetFillerdrawing",),
).copy()

# Define guard ring dimensions based on the inductor's bounding box
bbox = c.bbox()
xmin, ymin = bbox.left, bbox.bottom
xmax, ymax = bbox.right, bbox.top

margin_outer = 0.0
margin_inner = -15.0

xlo, xro = xmin - margin_outer, xmax + margin_outer
ybo, yto = ymin - margin_outer, ymax + margin_outer
xli, xri = xmin - margin_inner, xmax + margin_inner
ybi, yti = ymin - margin_inner, ymax + margin_inner

w_v = xli - xlo  # Width vertical walls
h_h = yto - yti  # Height horizontal walls
over = 0.5  # Overlap for Gmsh to fuse the pieces

# Left wall
c.add_ref(
    gf.components.rectangle(
        size=(w_v + over, yto - ybo), layer="Metal1drawing", centered=True
    )
).move((xlo + w_v / 2 + over / 2, (yto + ybo) / 2))
# Right wall
c.add_ref(
    gf.components.rectangle(
        size=(w_v + over, yto - ybo), layer="Metal1drawing", centered=True
    )
).move((xro - w_v / 2 - over / 2, (yto + ybo) / 2))
# Top wall
c.add_ref(
    gf.components.rectangle(
        size=(xro - xlo, h_h + over), layer="Metal1drawing", centered=True
    )
).move(((xro + xlo) / 2, yto - h_h / 2 - over / 2))
# Bottom wall
c.add_ref(
    gf.components.rectangle(
        size=(xro - xlo, h_h + over), layer="Metal1drawing", centered=True
    )
).move(((xro + xlo) / 2, ybo + h_h / 2 + over / 2))

cc = c.copy()

c.draw_ports()
c.plot()
Configure and run simulation with DrivenSim
from gsim.palace import DrivenSim

# Create simulation object
sim = DrivenSim()

# Set output directory
sim.set_output_dir("./palace-sim-inductor")

# Set the component geometry
sim.set_geometry(cc)

# Configure layer stack from active PDK
sim.set_stack(substrate_thickness=180.0, include_substrate=True)

# Configure ports
sim.add_port(
    "P1", from_layer="metal1", to_layer="topmetal2", geometry="interlayer", excited=True
)
sim.add_port(
    "P2", from_layer="metal1", to_layer="topmetal2", geometry="interlayer", excited=True
)

# Configure driven simulation (frequency sweep for S-parameters)
sim.set_driven(fmin=10e9, fmax=200e9, num_points=501)

# Validate configuration
print(sim.validate_config())
Validation: PASSED
# Generate mesh (presets: "coarse", "default", "fine")
sim.set_airbox(margin_x=50, margin_y=50, z_above=50, z_below=5)
sim.mesh(preset="default", refined_mesh_size=1.5)
Small conductor feature detected (2.000 um) may be under-resolved by refined_mesh_size=1.500 um. The heuristic target is <= 1.000 um (2 cells/feature). Reduce refined_mesh_size; auto_size=True preserves an explicit size.


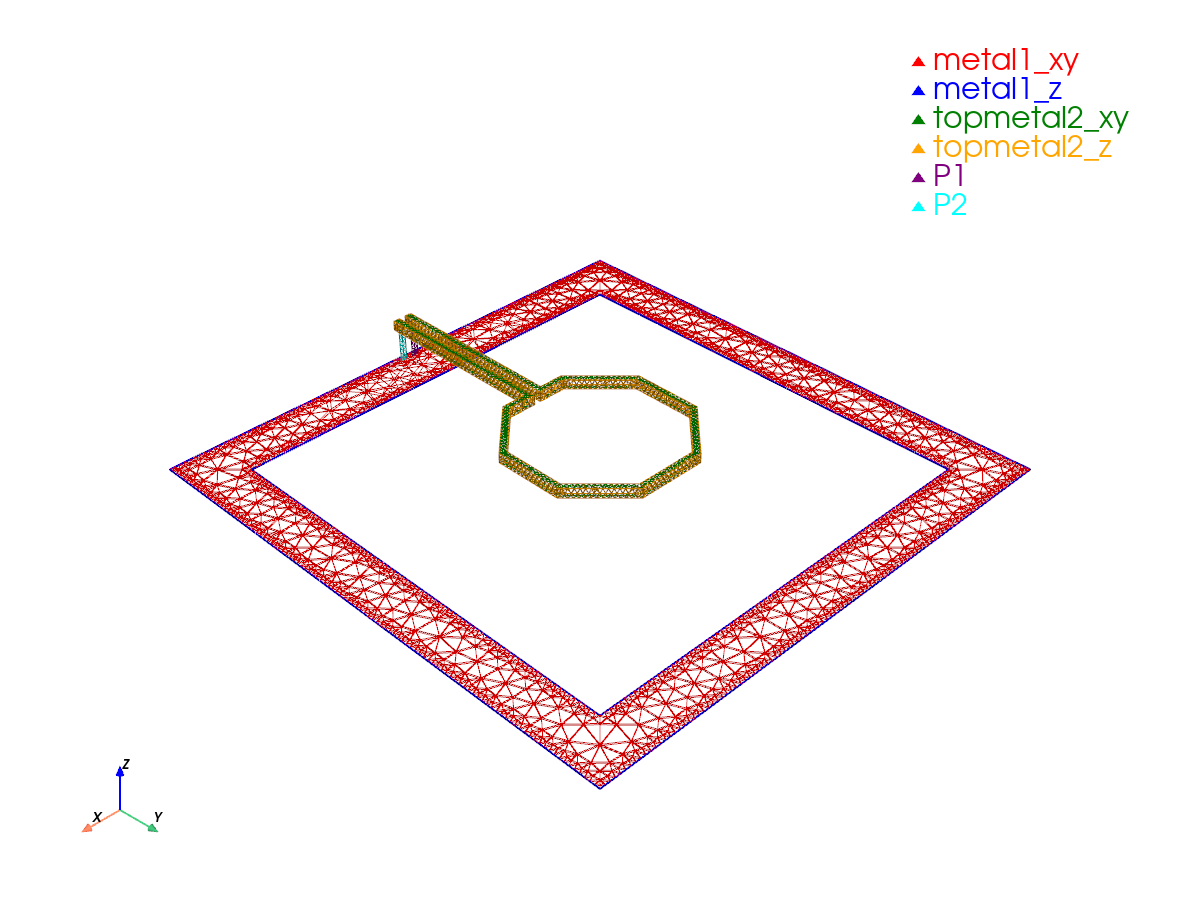
Mesh Summary
========================================
Dimensions: 262.6 x 262.6 x 250.9 µm
Nodes:      22,430
Elements:   167,881
Tetrahedra: 126,378
Edge length: 0.42 - 86.86 µm
Quality:    0.584 (min: 0.009)
SICN:       0.633 (all valid)
Worst element distortion, κ: 105.862 (tet centers; 1 is ideal)
Estimated Field DOFs: 805,126 (order 2; before Palace preprocessing)
Mesh hash:  sha256:f282a49bc19c5eb7  (gmsh 4.15.2, gsim 0.8.0)
Mesher:     2D algorithm 5, 3D algorithm 1, threads 1 (1D/2D/3D limits 1/1/1)
----------------------------------------
Volumes (4):
  - silicon [1]
  - sio2 [2]
  - sin [3]
  - air [4]
Surfaces (12):
  - metal1_xy [5]
  - metal1_z [6]
  - topmetal2_xy [7]
  - topmetal2_z [8]
  - P1 [9]
  - P2 [10]
  - air__silicon [11]
  - silicon__sio2 [12]
  - air__sio2 [13]
  - sin__sio2 [14]
  - air__sin [15]
  - air__None [16]
----------------------------------------
Mesh:   palace-sim-inductor/palace.msh
[0m[33m2026-10-23 15:32:40.373 ( 12.782s) [ 7F55703FC080]vtkXOpenGLRenderWindow.:1452 WARN| bad X server connection. DISPLAY=[0m
Run simulation on cloud
  palace-812cce45  [####################] 100%  complete  elapsed 0m 00s


Extracting results.tar.gz...
Downloaded 13 files to sim-data-palace-812cce45
Port mapping: Port 1: P1, Port 2: P2
Port mapping: Port 1: P1, Port 2: P2
Analytical RLC Model Fit
Extract Differential Impedance
We assemble the S-parameter matrix from the simulation results into a scikit-rf Network object, which handles the conversion to Z-parameters. From the 2×2 Z-matrix we compute the differential impedance \(Z_\text{diff} = Z_{11} - Z_{12} - Z_{21} + Z_{22}\), which is the impedance seen between the two ports of the inductor under differential excitation.
import numpy as np

from gsim.palace import differential_impedance

f = results.freq * 1e9  # GHz -> Hz
w = 2 * np.pi * f

# S/Z/Y access + skrf conversion from the package: the network keeps the
# simulation's port order and the 50 Ohm reference impedance.
ntwk = results.to_skrf()
Z = ntwk.z

# Impedance between the two inductor ports under differential excitation
# (falls back to the driving-point Z11 for one-port setups).
Z_sim = differential_impedance(Z)
f_sim = f
Fit the RLC Model with the Package API
We model the inductor as a series RL branch in parallel with a parasitic capacitance C:
This workflow now ships in the package (gsim.palace.circuit):
fit_rlc implements the well-conditioned \((f_0, Q, R)\) parameterization,
seeds the optimizer from the data (\(f_0\) at the \(|Z|\) peak, \(R\) from the
low-frequency resistance, \(Q\) from the \(-3\) dB bandwidth) and solves with
JAX/Adam in log space when the optional JAX dependencies are installed
(a scipy least-squares fallback otherwise). The same call accepts the EM
S-parameters from the cloud run or Palace's exported circuit below.
from gsim.palace import fit_rlc

fit = fit_rlc(f_sim, Z_sim)

R_fit, L_fit, C_fit, f0_fit, Q_fit = fit.R, fit.L, fit.C, fit.f0, fit.Q
print(fit)
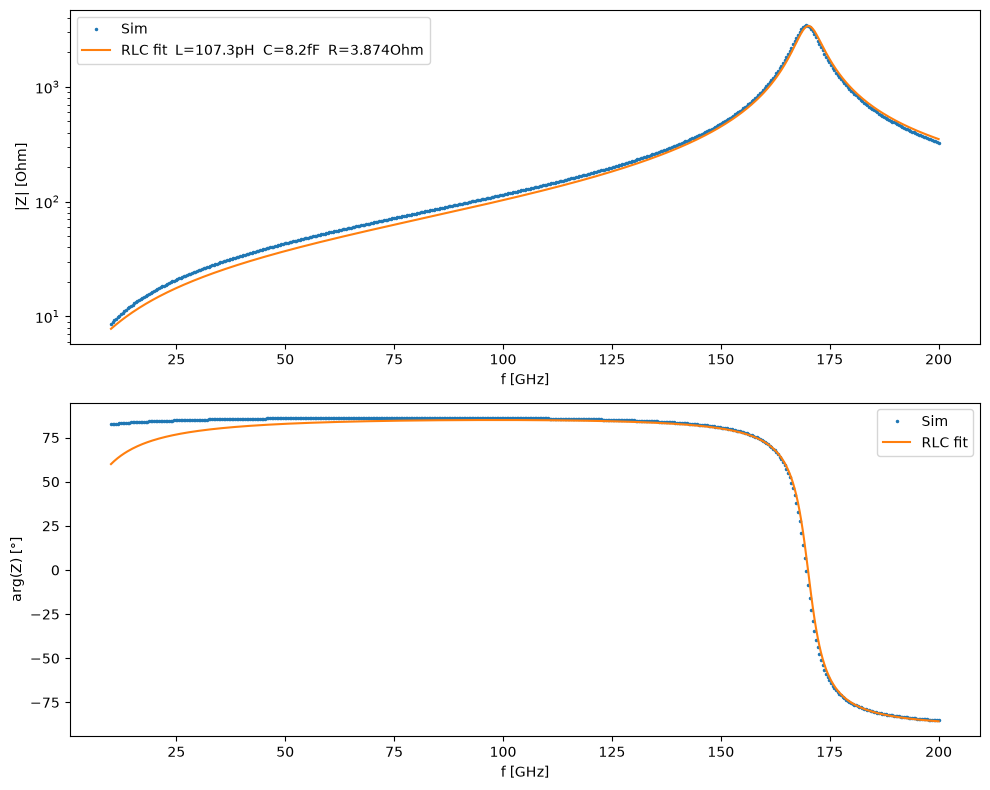
RLCFit(R=3.874 Ohm, L=107.314 pH, C=8.157 fF, f0=170.112 GHz, Q=29.61, rms=8.57e+01)
Results
We evaluate the fitted model across the full frequency range and compare it against the simulation data. The two plots show the magnitude \(|Z(f)|\) on a log scale and the phase \(\arg(Z(f))\) in degrees — a good fit should reproduce both the inductive rise, the resonance peak, and the phase transition.
import matplotlib.pyplot as plt

print(f"\nR = {R_fit:.6f} Ohm")
print(f"L = {L_fit * 1e12:.4f} pH")
print(f"C = {C_fit * 1e15:.4f} fF")
print(f"f0 = {f0_fit / 1e9:.4f} GHz  Q = {Q_fit:.3f}")

Z_fit = fit.z(f_sim)

fig, axes = plt.subplots(2, 1, figsize=(10, 8))
axes[0].plot(f_sim / 1e9, np.abs(Z_sim), ".", ms=3, label="Sim")
axes[0].plot(
    f_sim / 1e9,
    np.abs(Z_fit),
    label=f"RLC fit  L={L_fit * 1e12:.1f}pH  C={C_fit * 1e15:.1f}fF  R={R_fit:.3f}Ohm",
)
axes[0].set_yscale("log")
axes[0].set_xlabel("f [GHz]")
axes[0].set_ylabel("|Z| [Ohm]")
axes[0].legend()

axes[1].plot(f_sim / 1e9, np.angle(Z_sim, deg=True), ".", ms=3, label="Sim")
axes[1].plot(f_sim / 1e9, np.angle(Z_fit, deg=True), label="RLC fit")
axes[1].set_xlabel("f [GHz]")
axes[1].set_ylabel("arg(Z) [°]")
axes[1].legend()
plt.tight_layout()
plt.show()
R = 3.873819 Ohm
L = 107.3142 pH
C = 8.1566 fF
f0 = 170.1123 GHz  Q = 29.610
Circulax-Based Inverse Design
Define Circulax Component
With the fitted values from the analytical fit, we define my_inductor as a frequency-domain circulax component using @fdomain_component. The decorator converts the RLC admittance matrix into a two-port component compatible with any circulax netlist.
The admittance matrix for a symmetric two-port is:
The netlist connects the inductor directly between IN and GND — a single-port measurement configuration, consistent with how \(Z_\text{diff}\) was extracted from the simulation.
import jax
import jax.numpy as jnp

jax.config.update("jax_enable_x64", True)

from circulax import compile_circuit
from circulax.s_transforms import fdomain_component

# Equivalent circuit:
#
#         --- C ---
#        |         |
# p1 ----+---R--L--+---- p2


@fdomain_component(ports=("p1", "p2"))
def my_inductor(f, R=1.0, L=100e-12, C=10e-15):
    w = 2.0 * jnp.pi * f
    Y_RL = 1.0 / (R + 1j * w * L)  # series RL branch
    Y_C = 1j * w * C  # parallel capacitance
    Y = Y_RL + Y_C
    return jnp.array([[Y, -Y], [-Y, Y]], dtype=jnp.complex128)


net_dict = {
    "instances": {
        "GND": {"component": "ground"},
        "L1": {
            "component": "my_inductor",
            "settings": {"R": R_fit, "L": L_fit, "C": C_fit},
        },
    },
    "ports": {"IN": "L1,p1"},
    "connections": {
        "L1,p2": "GND,p1",
    },
}

models = {"my_inductor": my_inductor, "ground": lambda: 0}

circuit = compile_circuit(net_dict, models)
groups = circuit.groups
freqs = jnp.asarray(f_sim)
Z_target = jnp.asarray(Z_sim)

print("Circuit compiled. System size:", circuit.sys_size)
print("Port map:", circuit.port_map)
Circuit compiled. System size: 2
Port map: {'IN': 1, 'L1,p1': 1, 'GND,p1': 0, 'L1,p2': 0}
Inverse Design with Circulax
We use circulax inside the optimization loop as part of a differentiable inverse design workflow. At each step, we perform a full AC sweep and minimize the discrepancy between the compact-model impedance and the Palace simulation data:
where the impedance is recovered from the simulated reflection coefficient through the standard one-port relation
The optimization is initialized using the analytical RLC fit parameters. To ensure physically meaningful values throughout the optimization, we optimize unconstrained variables and map them to positive parameters using a softplus parameterization:
This enables stable gradient-based optimization using JAX automatic differentiation and Optax optimizers.
import optax

from circulax.solvers import setup_ac_sweep
from circulax.utils import update_params_dict

# Port node for IN — check port_map output above
port_node = next(v for k, v in circuit.port_map.items() if k == "IN")


# Positive parametrization
# raw_params -> softplus -> positive physical parameters
def positive(x):
    return jax.nn.softplus(x)


# inverse-softplus
def inv_softplus(y):
    return jnp.log(jnp.exp(y) - 1.0)


def loss_circulax(raw_params):
    params = positive(raw_params)
    R, L, C = params
    g = update_params_dict(groups, "my_inductor", "L1", "R", R)
    g = update_params_dict(g, "my_inductor", "L1", "L", L)
    g = update_params_dict(g, "my_inductor", "L1", "C", C)

    y_op = circuit.with_groups(g)()
    ac = setup_ac_sweep(groups=g, num_vars=circuit.sys_size, port_nodes=[port_node])
    sol = ac(freqs=freqs, y_dc=y_op)

    S11 = sol[:, 0, 0]
    Z_cx = 50.0 * (1 + S11) / (1 - S11)
    err_re = jnp.real(Z_cx) - jnp.real(Z_target)
    err_im = jnp.imag(Z_cx) - jnp.imag(Z_target)
    loss = jnp.mean(err_re**2 + err_im**2)

    return loss


raw_params_ini = inv_softplus(
    jnp.array(
        [
            R_fit,
            L_fit,
            C_fit,
        ]
    )
)

optimizer = optax.adam(1e-2)
opt_state = optimizer.init(raw_params_ini)
vg_fn = jax.jit(jax.value_and_grad(loss_circulax))
vg_fn(raw_params_ini)  # warm-up

raw_params = raw_params_ini
for step in range(500):
    loss, grads = vg_fn(raw_params)
    if step % 20 == 0:
        params = positive(raw_params)
        R_, L_, C_ = params
        print(
            f"step {step:3d}: R={float(R_):.5f} Ohm  L={float(L_) * 1e12:.3f} pH  C={float(C_) * 1e15:.3f} fF  loss={float(loss):.3e}"
        )
    updates, opt_state = optimizer.update(grads, opt_state)
    raw_params = optax.apply_updates(raw_params, updates)

R_fit_cx, L_fit_cx, C_fit_cx = [float(x) for x in positive(raw_params)]
f0_cx = 1.0 / (2 * np.pi * np.sqrt(L_fit_cx * C_fit_cx))
Q_cx = 2 * np.pi * f0_cx * L_fit_cx / R_fit_cx

print(f"\nR = {R_fit_cx:.6f} Ohm")
print(f"L = {L_fit_cx * 1e12:.4f} pH")
print(f"C = {C_fit_cx * 1e15:.4f} fF")
print(f"f0 = {f0_cx / 1e9:.4f} GHz  Q = {Q_cx:.3f}")
step   0: R=3.87382 Ohm  L=107.314 pH  C=8.216 fF  loss=1.167e+03
step  20: R=3.91478 Ohm  L=106.921 pH  C=8.187 fF  loss=7.160e+03
step  40: R=3.84276 Ohm  L=107.198 pH  C=8.194 fF  loss=1.163e+03
step  60: R=3.78988 Ohm  L=107.356 pH  C=8.195 fF  loss=2.601e+02
step  80: R=3.79437 Ohm  L=107.411 pH  C=8.196 fF  loss=2.385e+02
step 100: R=3.80298 Ohm  L=107.416 pH  C=8.193 fF  loss=2.242e+02
step 120: R=3.80332 Ohm  L=107.449 pH  C=8.190 fF  loss=2.222e+02
step 140: R=3.80520 Ohm  L=107.482 pH  C=8.188 fF  loss=2.209e+02
step 160: R=3.80788 Ohm  L=107.514 pH  C=8.186 fF  loss=2.196e+02
step 180: R=3.81019 Ohm  L=107.548 pH  C=8.183 fF  loss=2.184e+02
step 200: R=3.81265 Ohm  L=107.582 pH  C=8.181 fF  loss=2.172e+02
step 220: R=3.81515 Ohm  L=107.617 pH  C=8.178 fF  loss=2.160e+02
step 240: R=3.81765 Ohm  L=107.652 pH  C=8.175 fF  loss=2.149e+02


step 260: R=3.82015 Ohm  L=107.687 pH  C=8.173 fF  loss=2.138e+02
step 280: R=3.82265 Ohm  L=107.722 pH  C=8.170 fF  loss=2.128e+02
step 300: R=3.82511 Ohm  L=107.756 pH  C=8.167 fF  loss=2.119e+02
step 320: R=3.82754 Ohm  L=107.790 pH  C=8.165 fF  loss=2.110e+02
step 340: R=3.82992 Ohm  L=107.823 pH  C=8.162 fF  loss=2.102e+02
step 360: R=3.83225 Ohm  L=107.855 pH  C=8.160 fF  loss=2.094e+02
step 380: R=3.83452 Ohm  L=107.887 pH  C=8.157 fF  loss=2.087e+02
step 400: R=3.83671 Ohm  L=107.917 pH  C=8.155 fF  loss=2.081e+02
step 420: R=3.83884 Ohm  L=107.947 pH  C=8.153 fF  loss=2.075e+02
step 440: R=3.84088 Ohm  L=107.975 pH  C=8.151 fF  loss=2.070e+02
step 460: R=3.84284 Ohm  L=108.002 pH  C=8.149 fF  loss=2.066e+02
step 480: R=3.84472 Ohm  L=108.028 pH  C=8.147 fF  loss=2.062e+02

R = 3.846515 Ohm
L = 108.0532 pH
C = 8.1448 fF
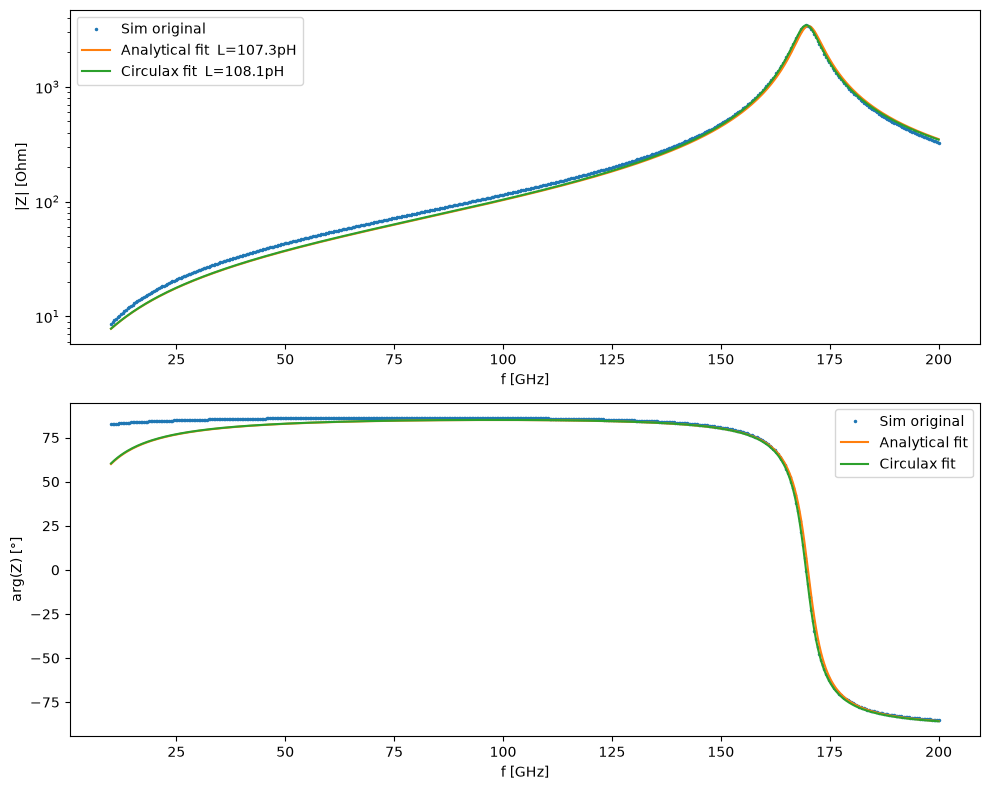
f0 = 169.6525 GHz  Q = 29.944
Results
We compare the analytical fit and the circulax inverse design against the original simulation data.
g_final = update_params_dict(groups, "my_inductor", "L1", "R", R_fit_cx)
g_final = update_params_dict(g_final, "my_inductor", "L1", "L", L_fit_cx)
g_final = update_params_dict(g_final, "my_inductor", "L1", "C", C_fit_cx)

y_op_final = circuit.with_groups(g_final)()
ac_final = setup_ac_sweep(
    groups=g_final, num_vars=circuit.sys_size, port_nodes=[port_node]
)
sol_final = ac_final(freqs=freqs, y_dc=y_op_final)

S11_final = sol_final[:, 0, 0]
Z_cx_final = 50.0 * (1 + S11_final) / (1 - S11_final)

fig, axes = plt.subplots(2, 1, figsize=(10, 8))
axes[0].plot(f_sim / 1e9, np.abs(Z_sim), ".", ms=3, label="Sim original")
axes[0].plot(
    f_sim / 1e9, np.abs(Z_fit), label=f"Analytical fit  L={L_fit * 1e12:.1f}pH"
)
axes[0].plot(
    f_sim / 1e9, np.abs(Z_cx_final), label=f"Circulax fit  L={L_fit_cx * 1e12:.1f}pH"
)
axes[0].set_yscale("log")
axes[0].set_xlabel("f [GHz]")
axes[0].set_ylabel("|Z| [Ohm]")
axes[0].legend()

axes[1].plot(
    f_sim / 1e9, np.angle(np.array(Z_sim), deg=True), ".", ms=3, label="Sim original"
)
axes[1].plot(f_sim / 1e9, np.angle(np.array(Z_fit), deg=True), label="Analytical fit")
axes[1].plot(
    f_sim / 1e9, np.angle(np.array(Z_cx_final), deg=True), label="Circulax fit"
)
axes[1].set_xlabel("f [GHz]")
axes[1].set_ylabel("arg(Z) [°]")
axes[1].legend()
plt.tight_layout()
plt.show()
AC Circuit Synthesis from Palace
Palace ≥ 0.17 can synthesize a lumped L/R/C circuit directly from the adaptive driven solver (circuit extraction). gsim exposes the flag through set_driven(..., circuit_synthesis=True), which requires an adaptive sweep (adaptive_tol > 0).
Instead of fitting an equivalent circuit to the simulated S-parameters, Palace exports the reduced-order model itself as a circuit: rom-Linv/Rinv/C-*.csv matrices (SI units), per-port termination blocks (rom-portload-*.csv), port reference admittances and eigenvalue estimates. The synthesized admittance pencil is
with circuit nodes ordered ports first (port_<i>_re), then interior synthesized nodes (sample_*). Port rows/columns carry physical volts/amps, so the external port admittance follows by eliminating the interior nodes (Schur complement) — that is the reusable EM-to-circuit model evaluated below.
This section evaluates the feature (gsim issue #272) on the same inductor using the local Palace runtime, and demonstrates three ways to extract circuit parameters — from a simple direct readout to a full broadband condensed model.
import json
import re
import subprocess
from pathlib import Path

from gsim.palace import DrivenSim, load_sparams
from gsim.palace.circuit import MIN_PALACE_VERSION
from gsim.palace.runtime import resolve_palace_binary

# Cached outputs from a previous local run (see provenance.json). Delete the
# directory to force a fresh local simulation.
cache_dir = Path("nbs/data/inductor/circuit_synthesis")
use_cache = (cache_dir / "rom-Linv-re.csv").exists()


def _palace_version(binary):
    if binary is None:
        return "unknown"
    out = subprocess.run(
        [str(binary), "--version"], capture_output=True, text=True, check=False
    ).stdout
    match = re.search(r"v\d+\.\d+\.\d+", out)
    return match.group(0) if match else "unknown"


if use_cache:
    provenance = json.loads((cache_dir / "provenance.json").read_text())
    palace_version = provenance["palace_version"]
    cs_results = load_sparams(cache_dir)
    cs_source = cache_dir
    print(f"Loaded cached circuit-synthesis results (Palace {palace_version})")
else:
    palace_version = _palace_version(resolve_palace_binary())
    print(f"Running locally with Palace {palace_version} ...")

    sim_cs = DrivenSim()
    sim_cs.set_output_dir("./palace-sim-inductor-cs")
    sim_cs.set_geometry(cc)
    sim_cs.set_stack(substrate_thickness=180.0, include_substrate=True)
    sim_cs.add_port(
        "P1",
        from_layer="metal1",
        to_layer="topmetal2",
        geometry="interlayer",
        excited=True,
    )
    sim_cs.add_port(
        "P2",
        from_layer="metal1",
        to_layer="topmetal2",
        geometry="interlayer",
        excited=True,
    )
    # Adaptive sweep + circuit synthesis: Palace exports the ROM as an
    # L/R/C circuit (rom-*.csv) alongside the S-parameters.
    sim_cs.set_driven(fmin=10e9, fmax=200e9, num_points=201, circuit_synthesis=True)
    sim_cs.set_airbox(margin_x=50, margin_y=50, z_above=50, z_below=5)
    sim_cs.mesh(preset="default", refined_mesh_size=1.5)
    sim_cs.write_config()
    cs_results = sim_cs.run_local(verbose=False)
    cs_source = cs_results
    print("Done.")

# Record the supported runtime version (rom-*.csv output needs >= 0.17.0).
parsed = tuple(int(x) for x in re.findall(r"\d+", palace_version)[:3])
if len(parsed) == 3 and parsed < tuple(int(x) for x in MIN_PALACE_VERSION.split(".")):
    print(
        f"WARNING: Palace {palace_version} < {MIN_PALACE_VERSION} lacks circuit synthesis"
    )
else:
    print("Palace runtime version:", palace_version)

cs_f = cs_results.freq * 1e9  # GHz -> Hz
Loaded cached circuit-synthesis results (Palace v0.18.0)
Palace runtime version: v0.18.0
from gsim.palace import load_circuit_synthesis

circuit = load_circuit_synthesis(cs_source, port_map={1: "P1", 2: "P2"})

print(circuit)
print("port nodes:    ", circuit.port_labels)
print(
    "interior nodes:", len(circuit.internal_indices), "(adaptive-sweep sample states)"
)
print("first nodes:   ", circuit.nodes[:6])

# The pencil evaluates at ANY frequency in (or near) the trained band:
Y_full = circuit.Y(cs_f)
print("Y_syn shape (nf, nodes, nodes):", Y_full.shape, "[S]")
CircuitSynthesis(nodes=108 [2 ports, 106 interior], files=10)
port nodes:     ['port_1_re', 'port_2_re']
interior nodes: 106 (adaptive-sweep sample states)
first nodes:    ['port_1_re', 'port_2_re', 'sample_e1_s0_re', 'sample_e1_s0_im', 'sample_e1_s1_re', 'sample_e1_s1_im']
Y_syn shape (nf, nodes, nodes): (201, 108, 108) [S]
Method A — direct readout from the port block (simple model)
The port terminal nodes are the first rows/columns of the synthesized matrices, in physical volts/amps. Reading the port block directly gives the simplest circuit parameters:
- the port termination from \(\widehat{R}^{-1}\) — each excited lumped port contributes \(1/R\) on its diagonal (the 50 Ω references), also exported separately per port in
rom-portload-*; - the pad self-capacitances from the diagonal of \(\widehat{C}\) (small and mesh-dependent — Palace documents that refining the mesh at the port shrinks them).
For this distributed device the port block has no direct port-to-port inductive coupling: the series inductance lives in the coupling between the port and interior nodes, so a meaningful \(L\) requires condensing the full circuit (Method B).
import numpy as np

p_idx = circuit.port_indices
C_port = circuit.C[np.ix_(p_idx, p_idx)]
Linv_port = circuit.L_inv[np.ix_(p_idx, p_idx)]

print("port reference impedances:", circuit.port_reference_impedances(), "Ohm")
print(
    "port pad capacitances:    ",
    [f"{x * 1e18:.2f} aF" for x in np.diag(C_port).real],
)
print(
    f"direct port-port L^-1 off-diagonal: {Linv_port[0, 1].real:.3e} 1/H (=> no local L)"
)
port reference impedances: [50. 50.] Ohm
port pad capacitances:     ['5.73 aF', '5.77 aF']
direct port-port L^-1 off-diagonal: 0.000e+00 1/H (=> no local L)
Method B — condensed broadband model (complex model)
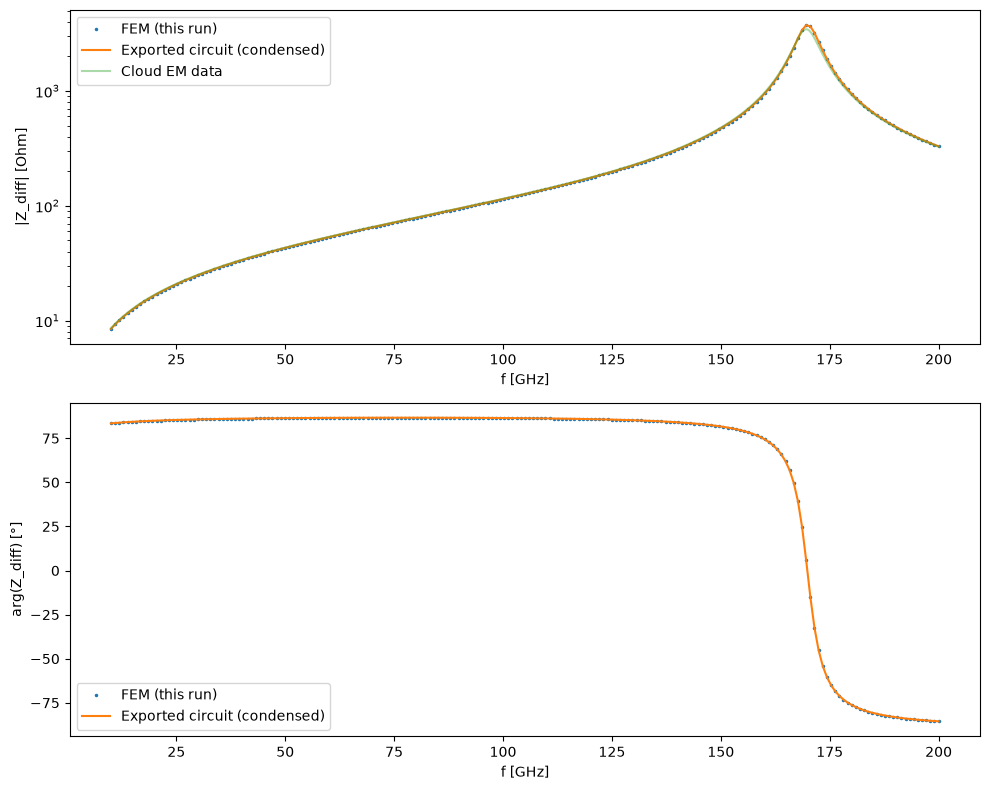
Eliminating the interior nodes with a Schur complement collapses the exported circuit to the external \(N_p \times N_p\) port admittance; subtracting the rom-portload terminations (the 50 Ω resistors) yields the bare device admittance \(Y_\text{dev}(\omega)\) — a reusable broadband circuit model. From it we recover the same differential impedance used in the RLC fit section,
now generated from the exported circuit instead of the EM S-parameters, and compare it against the FEM response of this run and the cloud EM data.
import matplotlib.pyplot as plt
import skrf as rf

from gsim.palace import differential_impedance

# Bare-device admittance: eliminate interior nodes, subtract port loads.
Y_dev = circuit.port_admittance(cs_f, subtract_port_loads=True)
Z_dev = np.linalg.inv(Y_dev)
Z_diff_circ = differential_impedance(Z_dev)

# FEM reference of the same run: adaptive ROM port-S -> Z_diff.
S_fem = np.zeros((len(cs_f), 2, 2), dtype=complex)
for i, pi in enumerate(cs_results.port_names):
    for j, pj in enumerate(cs_results.port_names):
        S_fem[:, i, j] = cs_results[(pi, pj)].complex
Z_fem = rf.Network(f=cs_f, s=S_fem, f_unit="hz").z
Z_diff_fem = differential_impedance(Z_fem)

w_cs = 2 * np.pi * cs_f
low = cs_f < 30e9
print(
    f"L (low-freq, circuit) = {np.mean(np.imag(Z_diff_circ[low]) / w_cs[low]) * 1e12:.3f} pH"
)
print(
    f"L (low-freq, FEM S)   = {np.mean(np.imag(Z_diff_fem[low]) / w_cs[low]) * 1e12:.3f} pH"
)
print(f"R (low-freq, circuit) = {np.mean(np.real(Z_diff_circ[low])):.4f} Ohm")

# Exported-circuit S-parameters vs FEM (issue #272 criterion: < 0.01).
S_circ = circuit.s_parameters(cs_f)
s_err = float(np.abs(S_circ - S_fem).max())
print(f"max |S_circuit - S_fem| = {s_err:.3e}")

fig, axes = plt.subplots(2, 1, figsize=(10, 8))
axes[0].plot(cs_f / 1e9, np.abs(Z_diff_fem), ".", ms=3, label="FEM (this run)")
axes[0].plot(cs_f / 1e9, np.abs(Z_diff_circ), label="Exported circuit (condensed)")
axes[0].plot(f_sim / 1e9, np.abs(Z_sim), alpha=0.4, label="Cloud EM data")
axes[0].set_yscale("log")
axes[0].set_xlabel("f [GHz]")
axes[0].set_ylabel("|Z_diff| [Ohm]")
axes[0].legend()
axes[1].plot(
    cs_f / 1e9, np.angle(Z_diff_fem, deg=True), ".", ms=3, label="FEM (this run)"
)
axes[1].plot(
    cs_f / 1e9, np.angle(Z_diff_circ, deg=True), label="Exported circuit (condensed)"
)
axes[1].set_xlabel("f [GHz]")
axes[1].set_ylabel("arg(Z_diff) [°]")
axes[1].legend()
plt.tight_layout()
plt.show()
L (low-freq, circuit) = 132.384 pH
L (low-freq, FEM S)   = 132.414 pH
R (low-freq, circuit) = 1.4447 Ohm


max |S_circuit - S_fem| = 5.288e-04
Method C — the one-call RLC fit on the exported circuit
The fitting workflow now lives in the package (see the API docs): gsim.palace.fitting.fit_rlc normalizes the model to \((f_0, Q, R)\), seeds it from the data (peak location, −3 dB bandwidth, low-frequency resistance) and optimizes with JAX/Adam or scipy. Point it at the exported circuit's \(Z_\text{diff}\) and compare with the same fit on the FEM data:
This is the reusable EM-to-circuit step from the issue — the same call works on EM S-parameters, on the synthesized circuit, or on any Z(f) data.
from gsim.palace import fit_rlc

fit_cs = fit_rlc(cs_f, Z_diff_circ)
fit_fem = fit_rlc(cs_f, Z_diff_fem)

R_cs, L_cs, C_cs, f0_cs, Q_cs = fit_cs.R, fit_cs.L, fit_cs.C, fit_cs.f0, fit_cs.Q
R_em2, L_em2, C_em2, f0_em2, Q_em2 = (
    fit_fem.R,
    fit_fem.L,
    fit_fem.C,
    fit_fem.f0,
    fit_fem.Q,
)


print(
    f"{'source':24s} {'R [Ohm]':>9s} {'L [pH]':>9s} {'C [fF]':>8s} "
    f"{'f0 [GHz]':>9s} {'Q':>7s}"
)
rows = (
    ("FEM S (this run)", (R_em2, L_em2, C_em2, f0_em2, Q_em2)),
    ("exported circuit", (R_cs, L_cs, C_cs, f0_cs, Q_cs)),
    ("cloud EM (fit above)", (R_fit, L_fit, C_fit, f0_fit, Q_fit)),
)
for name, (r_, l_, c_, f0_, q_) in rows:
    print(
        f"{name:24s} {r_:9.4f} {l_ * 1e12:9.3f} {c_ * 1e15:8.3f} "
        f"{f0_ / 1e9:9.3f} {q_:7.2f}"
    )
source                     R [Ohm]    L [pH]   C [fF]  f0 [GHz]       Q
FEM S (this run)            3.5285   107.941    8.136   169.831   32.64
exported circuit            3.5737   108.319    8.090   170.022   32.38
cloud EM (fit above)        3.8738   107.314    8.157   170.112   29.61
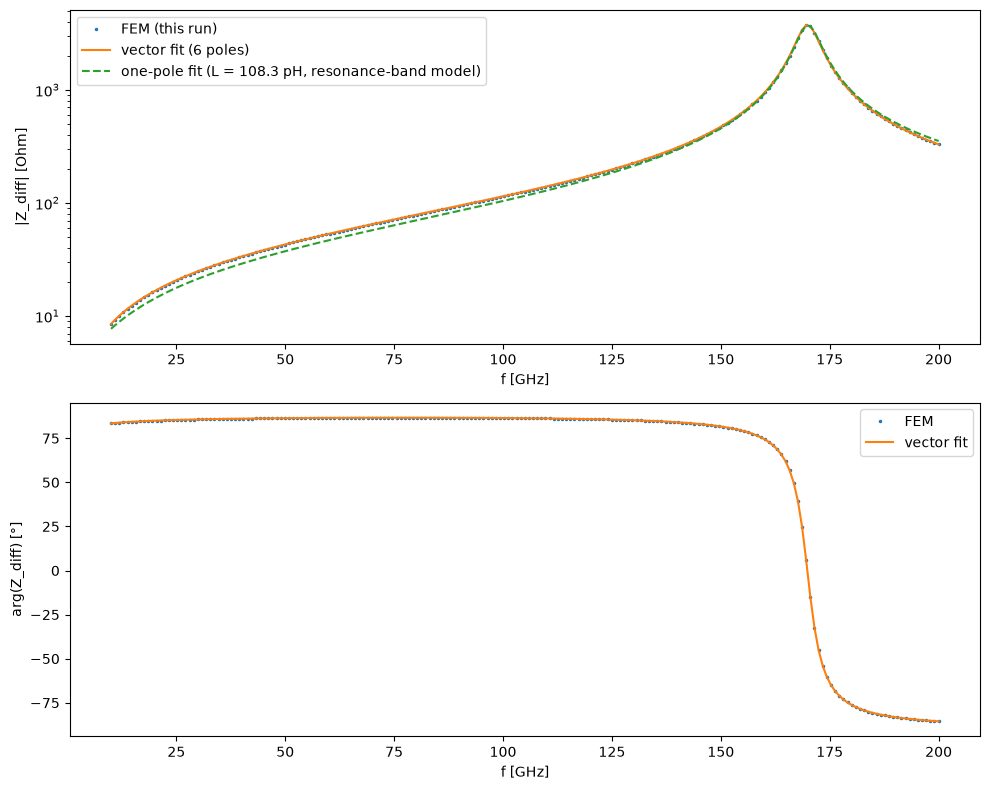
Method D — multi-pole vector fit (scikit-rf) with passivity checks
The one-pole model is a resonator equivalent (its L is tuned to the
resonance, not the low-frequency value). For the broadband reusable
model, fit_rlc(..., model="vector_fit") wraps scikit-rf's
VectorFitting around the exported circuit's port S-parameters: multiple
poles, a stability check (is_stable — all poles in the left half plane),
Palace-class passivity checks (is_passive / passivity_test /
passivity_enforce) and a SPICE subcircuit export (write_spice). This is
the issue's "stable, causal broadband models with passivity checks and SPICE
export" deliverable.
# Vector-fitting with passivity checks and SPICE export (issue #272).
fit_vf = circuit.fit_rlc(
    cs_f, model="vector_fit", n_poles_real=3, enforce_passivity=True
)
print(fit_vf)
print("poles [GHz, Re and Im]:")
for pole in sorted(fit_vf.poles, key=lambda p: p.real):
    print(
        f"  {pole.real / (2 * np.pi * 1e9):+9.3f} GHz  |  {pole.imag / (2 * np.pi * 1e9):+9.3f} GHz"
    )
print(
    f"stable = {fit_vf.is_stable} | passive = {fit_vf.is_passive()} | rms(S) = {fit_vf.rms_error():.2e}"
)

# Broadband Z_diff comparison: one-pole (resonator) vs vector fit vs FEM.
z_vf = differential_impedance(fit_vf.z(cs_f))
vf_err = float(np.max(np.abs(z_vf - Z_diff_fem) / np.abs(Z_diff_fem)))
print(
    f"max |Z_vf - Z_fem| / |Z_fem| = {vf_err:.3e}  (one-pole full-band model was off by ~20 % at low f)"
)

fig, axes = plt.subplots(2, 1, figsize=(10, 8))
axes[0].plot(cs_f / 1e9, np.abs(Z_diff_fem), ".", ms=3, label="FEM (this run)")
axes[0].plot(cs_f / 1e9, np.abs(z_vf), label=f"vector fit ({fit_vf.n_poles} poles)")
axes[0].plot(
    cs_f / 1e9,
    np.abs(fit_cs.z(cs_f)),
    "--",
    label=f"one-pole fit (L = {fit_cs.L * 1e12:.1f} pH, resonance-band model)",
)
axes[0].set_yscale("log")
axes[0].set_xlabel("f [GHz]")
axes[0].set_ylabel("|Z_diff| [Ohm]")
axes[0].legend()
axes[1].plot(cs_f / 1e9, np.angle(Z_diff_fem, deg=True), ".", ms=3, label="FEM")
axes[1].plot(cs_f / 1e9, np.angle(z_vf, deg=True), label="vector fit")
axes[1].set_xlabel("f [GHz]")
axes[1].set_ylabel("arg(Z_diff) [°]")
axes[1].legend()
plt.tight_layout()
plt.show()

# SPICE subcircuit export of the broadband model.
out_dir = Path("output")
out_dir.mkdir(exist_ok=True)
spice_path = out_dir / "inductor_vector_fit.spice"
fit_vf.write_spice(spice_path)
print("SPICE subcircuit written to", spice_path)
VectorFit(n_poles=6, ports=2, stable=True, passive=True, rms=6.34e-05)
poles [GHz, Re and Im]:
   -304.838 GHz  |     +0.000 GHz
   -117.937 GHz  |   +161.305 GHz
    -99.056 GHz  |   +277.349 GHz
    -33.974 GHz  |     +0.000 GHz
    -27.549 GHz  |   +202.425 GHz
    -11.546 GHz  |     +0.000 GHz
stable = True | passive = True | rms(S) = 6.34e-05
max |Z_vf - Z_fem| / |Z_fem| = 1.471e-03  (one-pole full-band model was off by ~20 % at low f)
SPICE subcircuit written to output/inductor_vector_fit.spice
Validation
The exported circuit must reproduce the EM response across the sweep band — the acceptance criterion from gsim issue #272 is a maximum absolute complex-S error below 0.01 against the FEM data — and the compact parameters extracted from the circuit must match the ones fitted to the FEM data. The broadband vector fit (Method D) must additionally have stable poles, be passive, and track the FEM differential impedance across the band.
assert s_err < 1e-2, f"exported circuit deviates from FEM: max |dS| = {s_err:.3e}"
assert abs(L_cs - L_em2) / L_em2 < 0.02, "inductance mismatch between circuit and FEM"
assert abs(C_cs - C_em2) / C_em2 < 0.02, "capacitance mismatch between circuit and FEM"
assert abs(f0_cs - f0_em2) / f0_em2 < 0.005, (
    "resonance mismatch between circuit and FEM"
)
assert abs(Q_cs - Q_em2) / Q_em2 < 0.10, "Q mismatch between circuit and FEM"
assert abs(R_cs - R_em2) < 0.20 * R_em2, "resistance mismatch between circuit and FEM"
assert np.allclose(circuit.port_reference_impedances(), 50.0)

# Method D: broadband vector-fit model must be stable, passive and accurate.
assert fit_vf.is_stable, "vector-fit model has poles in the right half plane"
assert fit_vf.is_passive(), (
    "vector-fit model failed the passivity test after enforcement"
)
assert vf_err < 0.05, f"vector-fit Z_diff error {vf_err:.2e}"

print("All circuit-synthesis validation checks passed.")
print(f"  max |S_circuit - S_fem| = {s_err:.3e}  (< 0.01)")
print(
    f"  one-pole fit: R = {R_cs:.4f} Ohm, L = {L_cs * 1e12:.3f} pH (resonance-band), "
    f"C = {C_cs * 1e15:.3f} fF, f0 = {f0_cs / 1e9:.3f} GHz, Q = {Q_cs:.2f}"
)
print(
    f"  vector fit: {fit_vf.n_poles} poles, passive = {fit_vf.is_passive()}, rms(S) = {fit_vf.rms_error():.2e}"
)
print(
    f"  low-frequency device inductance (condensed circuit): L = {np.mean(np.imag(Z_diff_circ[low]) / w_cs[low]) * 1e12:.1f} pH"
)
print(f"  (Palace {palace_version}; rom-*.csv output requires >= {MIN_PALACE_VERSION})")
All circuit-synthesis validation checks passed.
  max |S_circuit - S_fem| = 5.288e-04  (< 0.01)
  one-pole fit: R = 3.5737 Ohm, L = 108.319 pH (resonance-band), C = 8.090 fF, f0 = 170.022 GHz, Q = 32.38
  vector fit: 6 poles, passive = True, rms(S) = 6.34e-05
  low-frequency device inductance (condensed circuit): L = 132.4 pH
  (Palace v0.18.0; rom-*.csv output requires >= 0.17.0)
Port-Definition Comparison — two interlayer ports vs gap port
The same device with an identical Metal1 guard ring, measured two ways (issues #257 / #272 — the controlled port-only comparison the standalone port-comparison experiment called for, now merged here):
- two
interlayerports (this notebook'sresults): each terminal referenced to the ring, differential impedance combined as \(Z_{11}-Z_{12}-Z_{21}+Z_{22}\); - one
gapport spanning the 2.1 μm terminal slot (committed Palace v0.18.0 outputs): \(S_{11}\to Z_{11}\) is the differential impedance.
Conversions keep frequency units, port order and the reference impedance
explicit (s_to_z in gsim.palace.circuit; incomplete matrices are
rejected). The full gap-port circuit-synthesis walkthrough lives in
palace_inductor_gap.ipynb.
import numpy as np

from gsim.palace import load_sparams, s_to_z

# Leg 1: two-interlayer-port EM run (Z_sim was extracted above).
z_two = Z_sim
f_two = f_sim

# Leg 2: gap-port EM run (committed cache, identical guard ring).
gap_results = load_sparams("nbs/data/inductor/circuit_synthesis_gap")
s_gap = np.asarray([complex(s) for s in gap_results["Pdiff", "Pdiff"].complex])[
    :, None, None
]
z_gap = s_to_z(s_gap, z0=50.0)[:, 0, 0]
f_gap = gap_results.freq * 1e9
print(f"leg 1: {len(f_two)} points  |  leg 2: {len(f_gap)} points (gap cache)")
leg 1: 501 points | leg 2: 201 points (gap cache)
import matplotlib.pyplot as plt

from gsim.palace import fit_rlc


def estimate_resonance_ghz(frequency_ghz, impedance) -> float:
    """Peak of |Z| with a quadratic refinement around the maximum."""
    peak = int(np.argmax(np.abs(impedance)))
    if peak in (0, len(frequency_ghz) - 1):
        return float(frequency_ghz[peak])
    sl = slice(peak - 1, peak + 2)
    coeffs = np.polyfit(frequency_ghz[sl], np.log(np.abs(impedance[sl])), deg=2)
    return float(-coeffs[1] / (2 * coeffs[0]))


fit_two = fit_rlc(f_two, z_two, solver="scipy")
fit_gap = fit_rlc(f_gap, z_gap, solver="scipy")
w_two, w_gap = 2 * np.pi * f_two, 2 * np.pi * f_gap
low_two, low_gap = f_two < 30e9, f_gap < 30e9
l_two = float(np.mean(np.imag(z_two[low_two]) / w_two[low_two]))
l_gap = float(np.mean(np.imag(z_gap[low_gap]) / w_gap[low_gap]))

print(
    f"{'leg':22s} {'L_lf [pH]':>10s} {'f0 [GHz]':>9s} {'Q':>6s} "
    f"{'peak |Z| [Ohm]':>15s} {'f_peak [GHz]':>13s}"
)
for name, ft, lf, fg, zg in (
    ("two interlayer ports", fit_two, l_two, f_two, z_two),
    ("gap port", fit_gap, l_gap, f_gap, z_gap),
):
    k = int(np.argmax(np.abs(zg)))
    print(
        f"{name:22s} {lf * 1e12:10.1f} {ft.f0 / 1e9:9.3f} {ft.Q:6.2f} "
        f"{np.abs(zg[k]):15.0f} {fg[k] / 1e9:13.2f}"
    )

fig, axes = plt.subplots(2, 1, figsize=(10, 8))
axes[0].plot(f_two / 1e9, np.abs(z_two), label="two interlayer ports")
axes[0].plot(f_gap / 1e9, np.abs(z_gap), label="gap port")
axes[0].set_yscale("log")
axes[0].set_ylabel("|Z| [Ohm]")
axes[0].set_xlabel("f [GHz]")
axes[0].legend()
axes[1].plot(f_gap / 1e9, np.angle(z_gap, deg=True))
axes[1].plot(f_two / 1e9, np.angle(z_two, deg=True))
axes[1].set_ylabel("arg(Z) [deg]")
axes[1].set_xlabel("f [GHz]")
plt.tight_layout()
plt.show()
leg                     L_lf [pH]  f0 [GHz]      Q  peak |Z| [Ohm]  f_peak [GHz]
two interlayer ports        133.7   169.653  29.85            3450        169.60
gap port                    124.9   170.713  32.84            3788        170.55
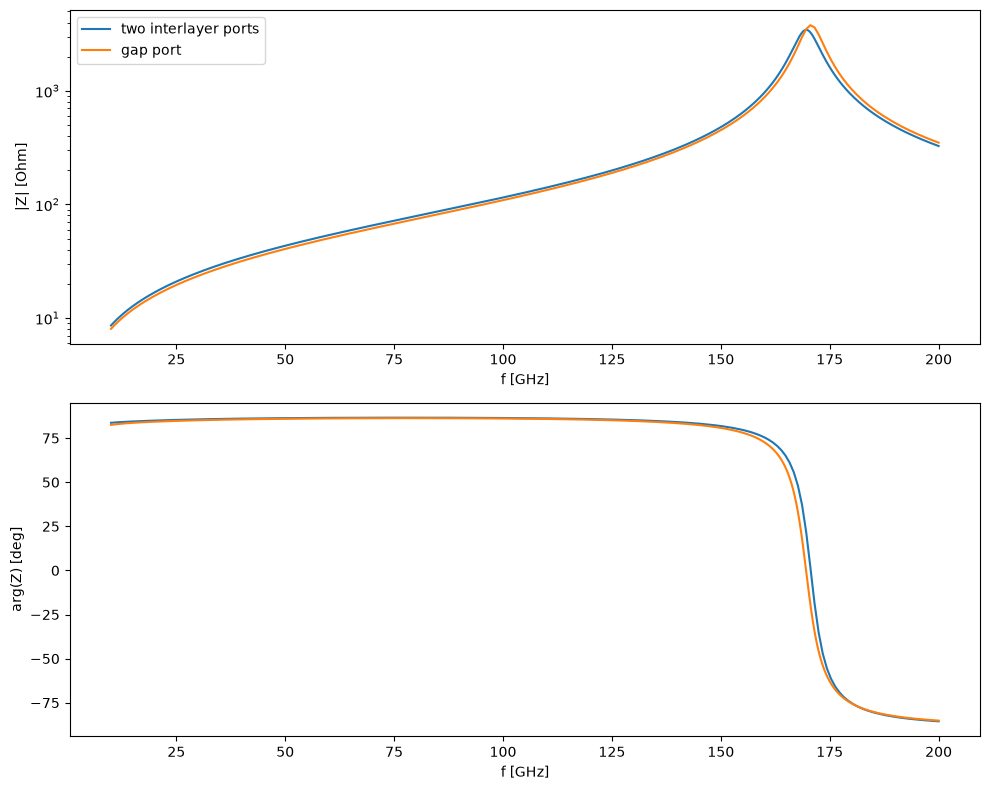
# The port definition alone shifts the low-frequency reference by ~6 %,
# while the resonance-region one-pole parameters agree to ~1 %
# (verified against the committed gap-port run; identical guard ring).
assert abs(fit_two.f0 - fit_gap.f0) / fit_gap.f0 < 0.02
assert abs(l_two - l_gap) / l_gap < 0.10
print("Port-definition comparison consistent with the controlled expectations.")
Port-definition comparison consistent with the controlled expectations.