Data analysis MZI#
We analyze the following MZI samples from the edx course
MZI1: dL_wg=0
MZI2: r=5 dL_path = (208.40000 - 148.15000) * 2 dL_wg = dL_path + 2pir - 42r = 111.915
MZI3: r=5 dL_path = (259.55000-148.15000) * 2 dL_wg = dL_path + 2pir - 42r ; dL_wg = 214.215
MZI4: r1 = 435.90000-427.60000; r1 r2 = 10 dL_path = (259.55000-148.15000) * 2 dL_wg = dL_path + pi*(r1+r2) - 4*(r1+r2) ; dL_wg = 207.08945
MZI5: r1 = 556.35000-547.60000; r1 r2 = 10 dL_path = (259.55000-148.15000) * 2 dL_wg = dL_path + pi*(r1+r2) - 4*(r1+r2) ; dL_wg = 206.703125
MZI6: r=4 dL_path = (259.55000-148.15000) * 2 dL_wg = dL_path + 2pir - 42r ; dL_wg = 215.932
MZI8: r=3 dL_path = (259.55000-148.15000) * 2 dL_wg = dL_path + 2pir - 42r ; dL_wg = 217.649
MZI17: r=2 dL_path = (259.55000-148.15000) * 2 dL_wg = dL_path + 2pir - 42r ; dL_wg = 219.366
import matplotlib.pyplot as plt
import numpy as np

import ubcpdk
from ubcpdk.simulation.circuits.mzi_spectrum import mzi_spectrum
w, p = ubcpdk.data.read_mat(ubcpdk.PATH.mzi1, port=0)
plt.plot(w, p)
[<matplotlib.lines.Line2D at 0x7fe52746be30>]
For some reason this MZI has an interference pattern. This is strange because the lengths of both arms are the same. This means that there was a strong height variation on the chip.
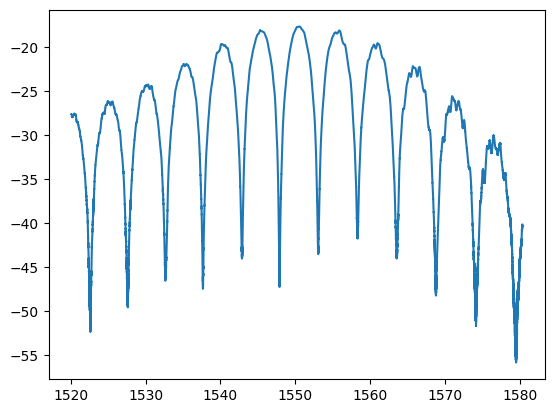
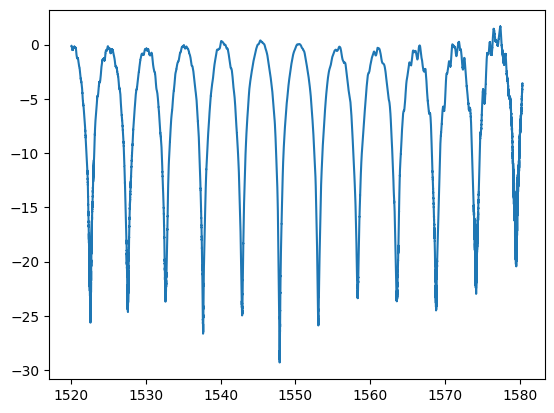
w, p = ubcpdk.data.read_mat(ubcpdk.PATH.mzi3, port=0)
plt.plot(w, p)
[<matplotlib.lines.Line2D at 0x7fe52778f590>]
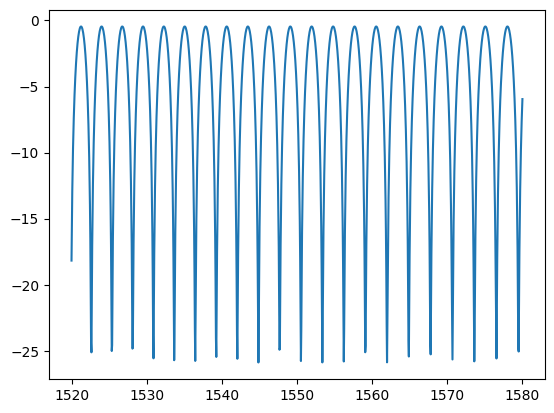
wr = np.linspace(1520, 1580, 1200) * 1e-3
pr = mzi_spectrum(L1_um=0, L2_um=214.215, wavelength_um=wr)
plt.plot(wr * 1e3, 10 * np.log10(pr))
[<matplotlib.lines.Line2D at 0x7fe4e72c6c90>]
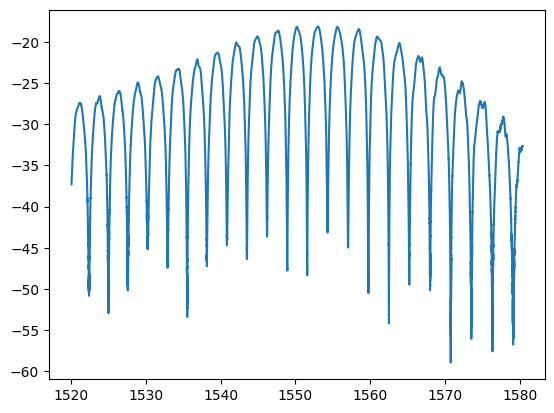
w, p = ubcpdk.data.read_mat(ubcpdk.PATH.mzi3, port=0)
pb = ubcpdk.data.remove_baseline(w, p)
plt.plot(w, pb)
[<matplotlib.lines.Line2D at 0x7fe4e733d640>]
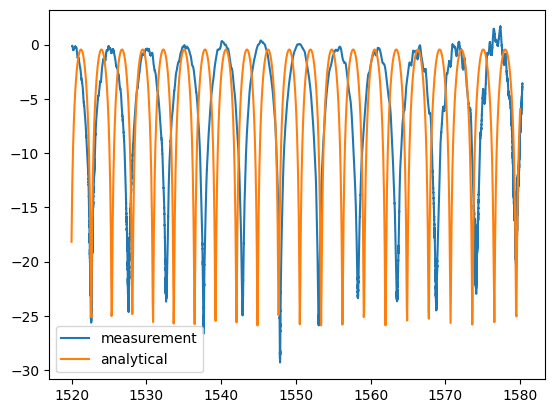
plt.plot(w, pb, label="measurement")
plt.plot(wr * 1e3, 10 * np.log10(pr), label="analytical")
plt.legend()
<matplotlib.legend.Legend at 0x7fe4e728d190>
ms.sweep_wavelength?
Object `ms.sweep_wavelength` not found.
from scipy.optimize import curve_fit
L1_um = 40
L2_um = L1_um + 215.932
def mzi_logscale(wavelength_um, alpha, n1, n2, n3):
return 10 * np.log10(
mzi_spectrum(
L1_um=L1_um,
L2_um=L2_um,
wavelength_um=wavelength_um,
alpha=alpha,
n1=n1,
n2=n2,
n3=n3,
)
)
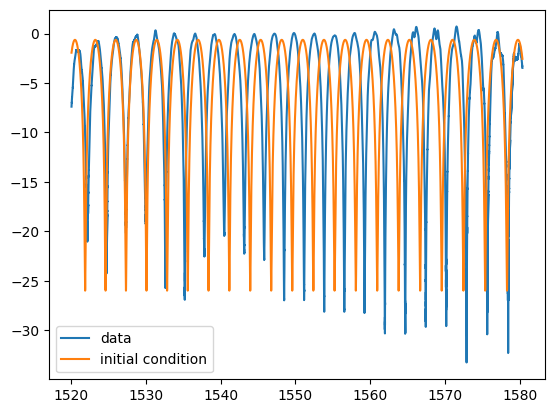
w, p = ubcpdk.data.read_mat(ubcpdk.PATH.mzi6, port=0)
wum = w * 1e-3
pb = ubcpdk.data.remove_baseline(w, p)
p0 = [1e-3, 2.4, -1, 0]
plt.plot(w, pb, label="data")
plt.plot(w, mzi_logscale(wum, *p0), label="initial condition")
plt.legend()
<matplotlib.legend.Legend at 0x7fe4e5170200>
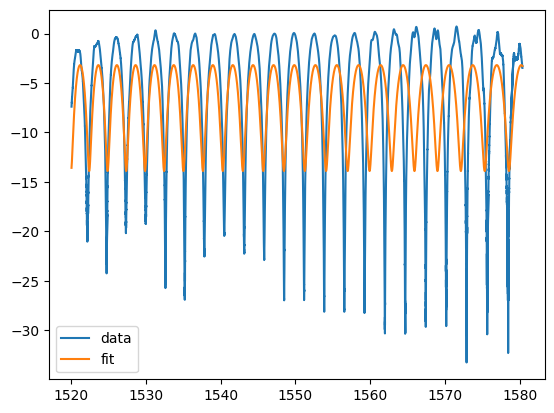
params, params_covariance = curve_fit(mzi_logscale, wum, pb, p0=[1e-3, 2.4, -1, 0])
params
array([ 0.00555726, 2.39711747, -1.01841085, 4.99322158])
plt.plot(w, pb, label="data")
plt.plot(w, mzi_logscale(wum, *params), label="fit")
plt.legend()
<matplotlib.legend.Legend at 0x7fe4e2004aa0>
L1_um = 40
L2_um = L1_um + 215.932
def mzi(wavelength_um, alpha, n1, n2, n3):
return mzi_spectrum(
L1_um=L1_um,
L2_um=L2_um,
wavelength_um=wavelength_um,
alpha=alpha,
n1=n1,
n2=n2,
n3=n3,
)
w, p = ubcpdk.data.read_mat(ubcpdk.PATH.mzi6, port=0)
wum = w * 1e-3
pb = ubcpdk.data.remove_baseline(w, p)
pb_linear = 10 ** (pb / 10)
p0 = [1e-3, 2.4, -1, 0]
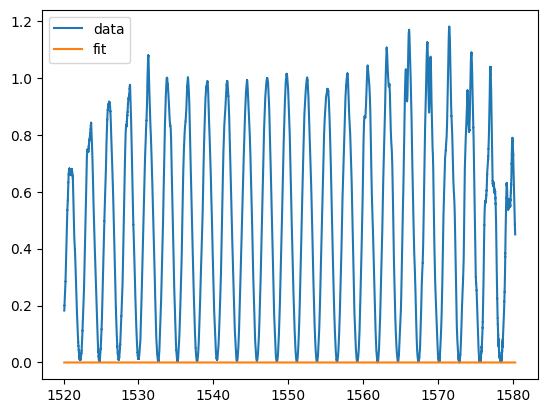
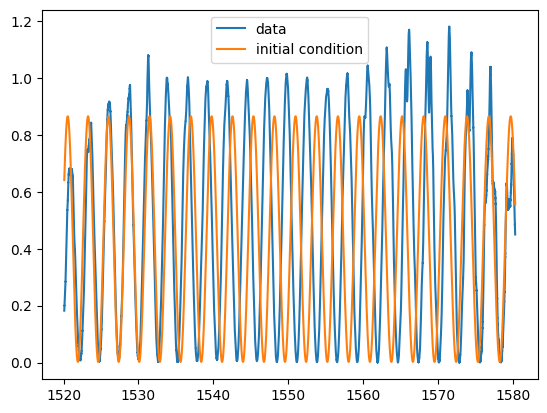
plt.plot(w, pb_linear, label="data")
plt.plot(w, mzi(wum, *p0), label="initial condition")
plt.legend()
<matplotlib.legend.Legend at 0x7fe4e2093410>
params, params_covariance = curve_fit(mzi, wum, pb, p0=p0)
/tmp/ipykernel_2698/2008316264.py:1: OptimizeWarning: Covariance of the parameters could not be estimated
  params, params_covariance = curve_fit(mzi, wum, pb, p0=p0)
plt.plot(w, pb_linear, label="data")
plt.plot(w, mzi(wum, *params), label="fit")
plt.legend()
<matplotlib.legend.Legend at 0x7fe52778eb40>