Path-length Analysis
This notebook demonstrates how to extract path-length and curvature from layout components.
Extract Path-length and Curvature from Components
In this section, we'll extract the centerline from components and compute key metrics:
- Path-length between ports
- Minimum radius of curvature, \(R\)
- Maximum curvature (radius⁻¹), \(\kappa = \frac{1}{R}\)
For details on the curvature calculation, see Ref.\(~\)[@weisstein_radius].
from IPython.display import display
import gdsfactory as gf
import matplotlib.pyplot as plt
import textwrap

from gplugins.path_length_analysis.path_length_analysis_from_gds import (
    extract_paths,
    get_min_radius_and_length_path_dict,
    plot_curvature,
)
Basic Example: Circular Bend
We start with a simple circular bend component to demonstrate the process.
c = gf.components.bend_circular()
path_dict, ev_path_dict = extract_paths(c, plot=True)
r_and_l_dict = get_min_radius_and_length_path_dict(path_dict)
for ports, (min_radius, length) in r_and_l_dict.items():
    print(
        textwrap.dedent(
            f"""
            Ports: {ports}
            Maximum curvature: {1 / min_radius:.2f}
            Minimum radius of curvature: {min_radius:.2f}
            Length: {length:.2f}
            """
        )
    )
    fig = plot_curvature(path_dict[ports])
    plt.show()
display(c.info)
difference_in_min_radius = abs(c.info["radius"] - min_radius) / c.info["radius"]
print(f"Relative difference in min radius: {difference_in_min_radius:.2%}")
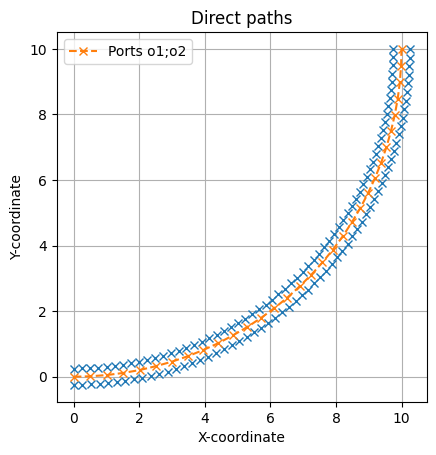
Ports: o1;o2
Maximum curvature: 0.11
Minimum radius of curvature: 9.35
Length: 15.71
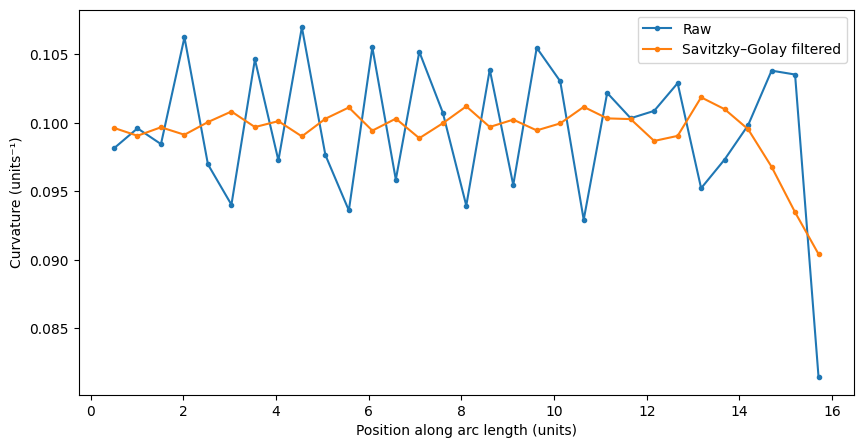
Info(length=15.708, dy=10.0, radius=10.0, width=0.5, route_info_type='strip', route_info_length=15.708, route_info_weight=15.708, route_info_strip_length=15.708, route_info_n_bend_90=1.0, route_info_min_bend_radius=10.0)


Relative difference in min radius: 6.53%
Results for Different Number of Points
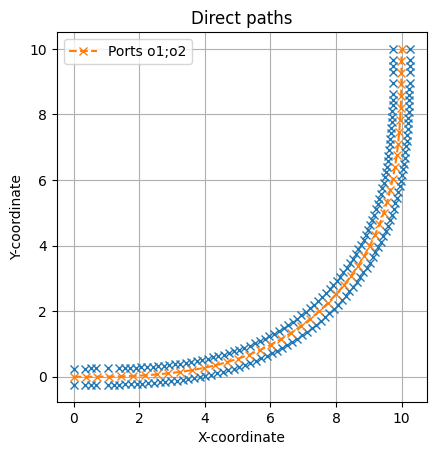
The accuracy of curvature calculations depends on the number of points used to define the component. Here, we show an Euler bend with varying number of polygon points (10, 50, 100 points) to observe how the calculated metrics change.
The smooth curvature transition of Euler bends should be better captured with higher point counts.
for npoints in [10, 50, 100]:
    c = gf.components.bend_euler(npoints=npoints)
    path_dict, ev_path_dict = extract_paths(c, plot=True)
    r_and_l_dict = get_min_radius_and_length_path_dict(path_dict)
    for ports, (min_radius, length) in r_and_l_dict.items():
        print(
            textwrap.dedent(
                f"""
                Ports: {ports}
                Maximum curvature: {1 / min_radius:.2f}
                Minimum radius of curvature: {min_radius:.2f}
                Length: {length:.2f}
                """
            )
        )
        fig = plot_curvature(path_dict[ports])
        plt.title(f"{npoints=}")
        plt.show()
    display(c.info)
    difference_in_min_radius = (
        abs(c.info["min_bend_radius"] - min_radius) / c.info["min_bend_radius"]
    )
    print(f"Relative difference in min radius: {difference_in_min_radius:.2%}")
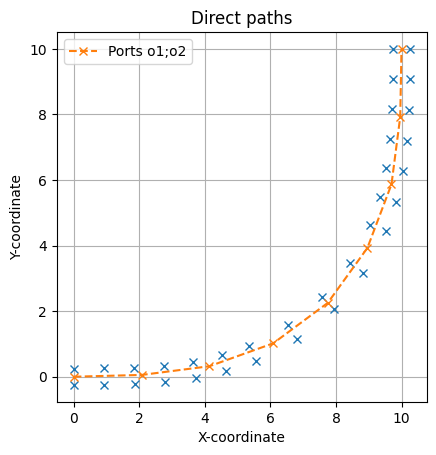
Ports: o1;o2
Maximum curvature: 0.15
Minimum radius of curvature: 6.88
Length: 16.59
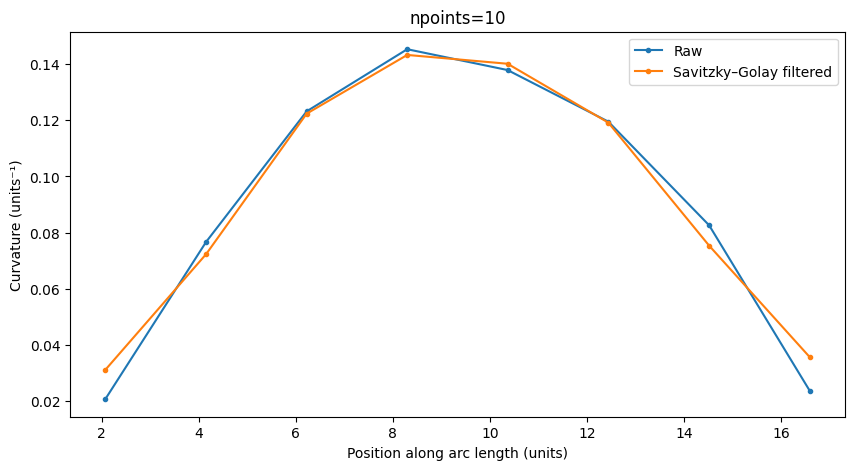
Info(length=16.625, dy=10.0, min_bend_radius=7.061, radius=10.0, width=0.5, route_info_type='strip', route_info_length=16.625, route_info_weight=16.625, route_info_strip_length=16.625, route_info_n_bend_90=1.0, route_info_min_bend_radius=7.061)


Relative difference in min radius: 2.55%
Ports: o1;o2
Maximum curvature: 0.15
Minimum radius of curvature: 6.65
Length: 16.64
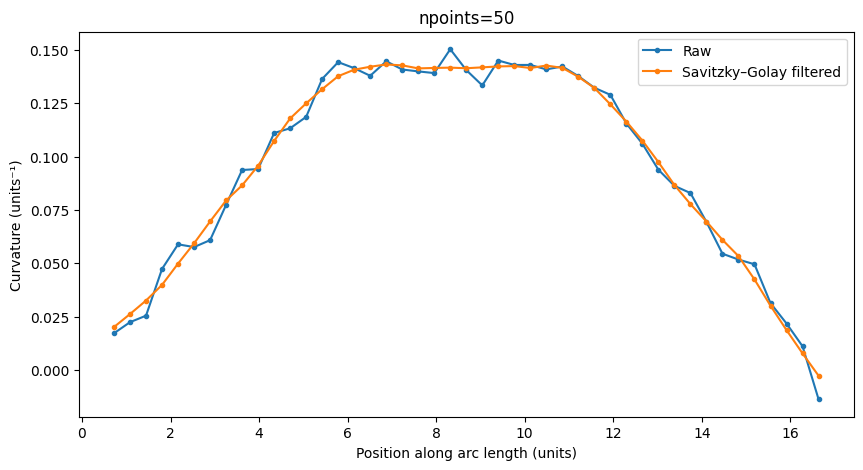
Info(length=16.637, dy=10.0, min_bend_radius=7.061, radius=10.0, width=0.5, route_info_type='strip', route_info_length=16.637, route_info_weight=16.637, route_info_strip_length=16.637, route_info_n_bend_90=1.0, route_info_min_bend_radius=7.061)


Relative difference in min radius: 5.76%
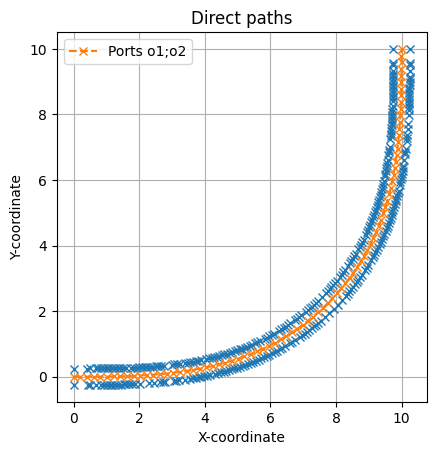
Ports: o1;o2
Maximum curvature: 0.15
Minimum radius of curvature: 6.54
Length: 16.64
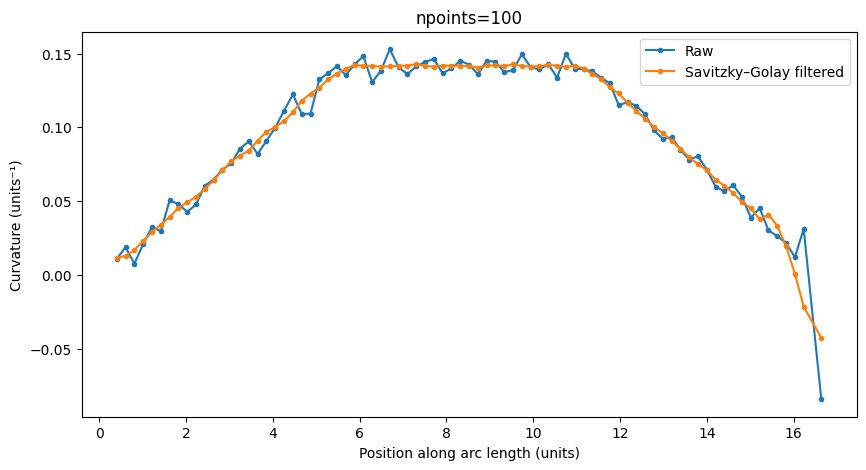
Info(length=16.637, dy=10.0, min_bend_radius=7.061, radius=10.0, width=0.5, route_info_type='strip', route_info_length=16.637, route_info_weight=16.637, route_info_strip_length=16.637, route_info_n_bend_90=1.0, route_info_min_bend_radius=7.061)


Relative difference in min radius: 7.40%
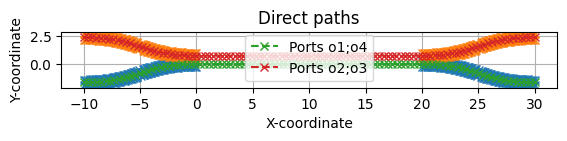
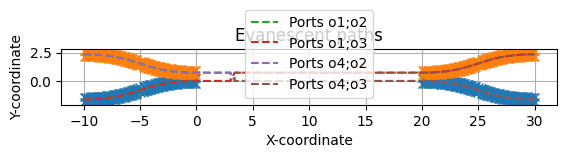
4-port component: directional Coupler
We can also handle components with:
- Multiple input/output ports
- An evanescent coupling region where light transfers between waveguides
The evanescent_coupling=True parameter enables analysis of the coupling regions.
c = gf.components.coupler()
path_dict, ev_path_dict = extract_paths(c, plot=True, evanescent_coupling=True)
r_and_l_dict = get_min_radius_and_length_path_dict(path_dict)
for ports, (min_radius, length) in r_and_l_dict.items():
    print(
        textwrap.dedent(
            f"""
            Ports: {ports}
            Maximum curvature: {1 / min_radius:.2f}
            Minimum radius of curvature: {min_radius:.2f}
            Length: {length:.2f}
            """
        )
    )
    fig = plot_curvature(path_dict[ports])
    plt.title(f"Ports: {ports}")
    plt.show()
display(c.info)
difference_in_min_radius = (
    abs(c.info["min_bend_radius"] - min_radius) / c.info["min_bend_radius"]
)
print(f"Relative difference in min radius: {difference_in_min_radius:.2%}")
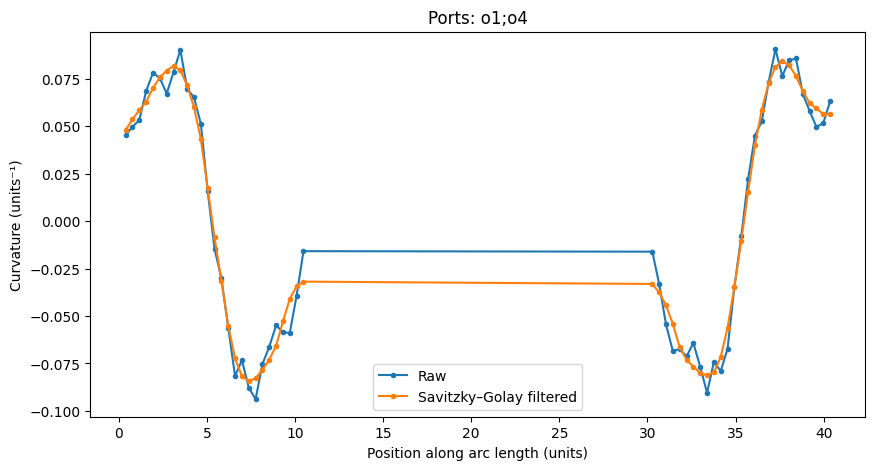
Ports: o1;o4
Maximum curvature: 0.09
Minimum radius of curvature: 10.65
Length: 40.37
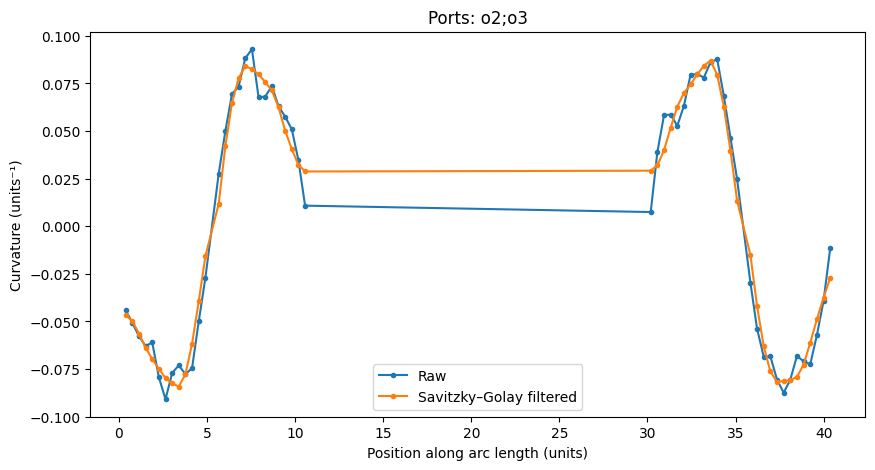
Ports: o2;o3
Maximum curvature: 0.09
Minimum radius of curvature: 10.76
Length: 40.37
Info(path_length=40.372, min_bend_radius=11.857000000000001)


Relative difference in min radius: 9.27%
Conclusion
This notebook demonstrates how to:
- Extract path information from layout photonic components
- Calculate important metrics (length, curvature)
- Visualize the results
Bibliography
Bibliography
:style: unsrt :filter: docname in docnames