gdsfactory.grid#
- gdsfactory.grid(components: list[str | ~collections.abc.Callable[[...], ~gdsfactory.component.Component] | ~gdsfactory.component.Component | dict[str, ~typing.Any]] | tuple[str | ~collections.abc.Callable[[...], ~gdsfactory.component.Component] | ~gdsfactory.component.Component | dict[str, ~typing.Any], ...] = (<function rectangle>, <function triangle>), spacing: tuple[float, float] = (5.0, 5.0), separation: bool = True, shape: tuple[int, int] | None = None, align_x: str = 'x', align_y: str = 'y', edge_x: str = 'x', edge_y: str = 'ymax', rotation: int = 0, h_mirror: bool = False, v_mirror: bool = False, add_ports_prefix: bool = True, name_ports_with_component_name: bool = False) Component[source]#
Returns Component with a 1D or 2D grid of components.
- Parameters:
components – Iterable to be placed onto a grid. (can be 1D or 2D).
spacing – between adjacent elements on the grid, can be a tuple for different distances in height and width.
separation – If True, guarantees elements are separated with fixed spacing if False, elements are spaced evenly along a grid.
shape – x, y shape of the grid (see np.reshape). If no shape and the list is 1D, if np.reshape were run with (1, -1).
align_x – {‘x’, ‘xmin’, ‘xmax’} for x (column) alignment along.
align_y – {‘y’, ‘ymin’, ‘ymax’} for y (row) alignment along.
edge_x – {‘x’, ‘xmin’, ‘xmax’} for x (column) (ignored if separation = True).
edge_y – {‘y’, ‘ymin’, ‘ymax’} for y (row) along (ignored if separation = True).
rotation – for each component in degrees.
h_mirror – horizontal mirror y axis (x, 1) (1, 0). most common mirror.
v_mirror – vertical mirror using x axis (1, y) (0, y).
add_ports_prefix – adds prefix to port names. False adds suffix.
name_ports_with_component_name – if True uses component.name as unique id. False uses index.
- Returns:
Component containing components grid.
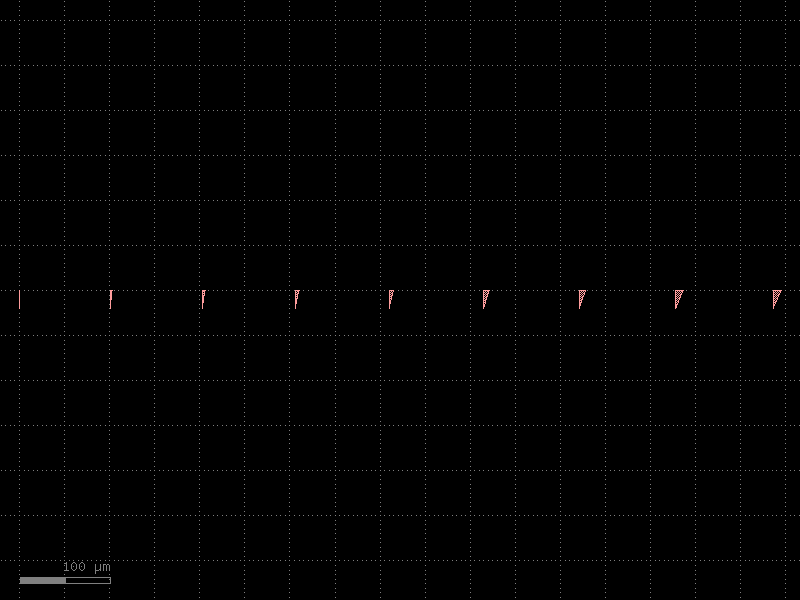
import gdsfactory as gf

components = [gf.components.triangle(x=i) for i in range(1, 10)]
c = gf.grid(
    components,
    shape=(1, len(components)),
    rotation=0,
    h_mirror=False,
    v_mirror=True,
    spacing=(100, 100),
)
c.plot()
(
Source code,png,hires.png,pdf)
