gplugins.sax.plot_model#
- gplugins.sax.plot_model(model: Annotated[Annotated[Callable[[...], dict[tuple[Annotated[str, PlainValidator(func=val_port, json_schema_input_type=Any)], Annotated[str, PlainValidator(func=val_port, json_schema_input_type=Any)]], Annotated[Array, complexfloating, PlainValidator(func=val_complex_array, json_schema_input_type=Any)]]], PlainValidator(func=val_model, json_schema_input_type=Any)] | Annotated[Callable[[...], tuple[Annotated[Array, complexfloating, PlainValidator(func=val_complex_array, json_schema_input_type=Any)], dict[Annotated[str, PlainValidator(func=val_port, json_schema_input_type=Any)], int]]], PlainValidator(func=val_model, json_schema_input_type=Any)] | Annotated[Callable[[...], tuple[Annotated[Array | ndarray, signedinteger, 1, PlainValidator(func=val_int_array_1d, json_schema_input_type=Any)], Annotated[Array | ndarray, signedinteger, 1, PlainValidator(func=val_int_array_1d, json_schema_input_type=Any)], Annotated[Array, complexfloating, PlainValidator(func=val_complex_array, json_schema_input_type=Any)], dict[Annotated[str, PlainValidator(func=val_port, json_schema_input_type=Any)], int]]], PlainValidator(func=val_model, json_schema_input_type=Any)], PlainValidator(func=val_model, json_schema_input_type=Any)] | Annotated[Annotated[Callable[[...], tuple[Annotated[Array, complexfloating, PlainValidator(func=val_complex_array, json_schema_input_type=Any)], dict[Annotated[str, PlainValidator(func=val_port_mode, json_schema_input_type=Any)], int]]], PlainValidator(func=val_model, json_schema_input_type=Any)] | Annotated[Callable[[...], tuple[Annotated[Array | ndarray, signedinteger, 1, PlainValidator(func=val_int_array_1d, json_schema_input_type=Any)], Annotated[Array | ndarray, signedinteger, 1, PlainValidator(func=val_int_array_1d, json_schema_input_type=Any)], Annotated[Array, complexfloating, PlainValidator(func=val_complex_array, json_schema_input_type=Any)], dict[Annotated[str, PlainValidator(func=val_port_mode, json_schema_input_type=Any)], int]]], PlainValidator(func=val_model, json_schema_input_type=Any)] | Annotated[Callable[[...], dict[tuple[Annotated[str, PlainValidator(func=val_port_mode, json_schema_input_type=Any)], Annotated[str, PlainValidator(func=val_port_mode, json_schema_input_type=Any)]], Annotated[Array, complexfloating, PlainValidator(func=val_complex_array, json_schema_input_type=Any)]]], PlainValidator(func=val_model, json_schema_input_type=Any)], PlainValidator(func=val_model, json_schema_input_type=Any)], port1: str = 'o1', ports2: tuple[str, ...] | None = None, logscale: bool = True, min_db_range: float = 0.5, fig=None, wavelength_start: float = 1.5, wavelength_stop: float = 1.6, wavelength_points: int = 2000, phase: bool = False, title: str | None = None) None[source]#
Plot Model Sparameters Magnitude.
- Parameters:
model – function that returns SDict as function of wavelength.
port1 – input port name.
ports2 – list of ports.
logscale – plots in dB logarithmic scale.
min_db_range – minimum dB range. Set to 0 to disable.
fig – matplotlib figure.
wavelength_start – wavelength min (µm).
wavelength_stop – wavelength max (µm).
wavelength_points – number of wavelength steps.
phase – plot phase instead of magnitude.
title – plot title.
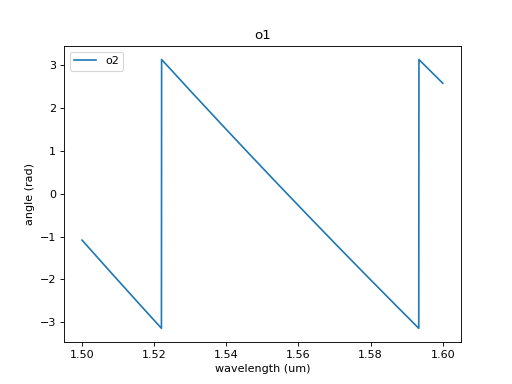
import gplugins.sax as gs

gs.plot_model(gs.models.straight, phase=True, port1="o1")
(
Source code,png,hires.png,pdf)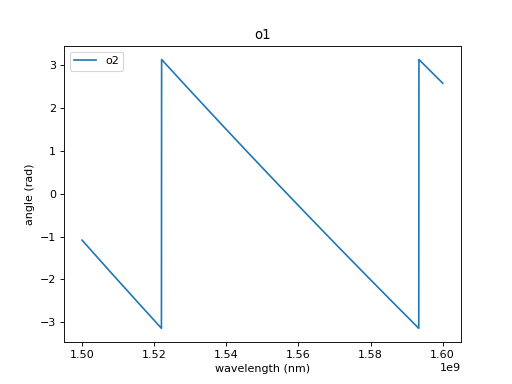