FDTD tidy3d#
tidy3D is a fast GPU based FDTD tool developed by flexcompute.
To run, you need to create an account and add credits. The number of credits that each simulation takes depends on the simulation size and computation time.

Materials#
To use gdsfactory LayerStack for different PDKs into tidy3d you have to create a mapping between each material name from the LayerStack into a tidy3d Medim
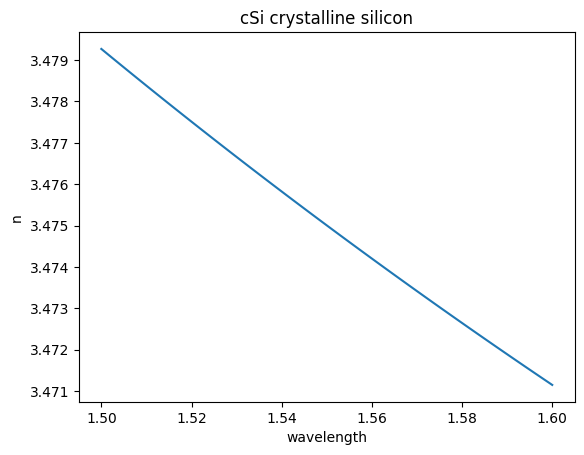
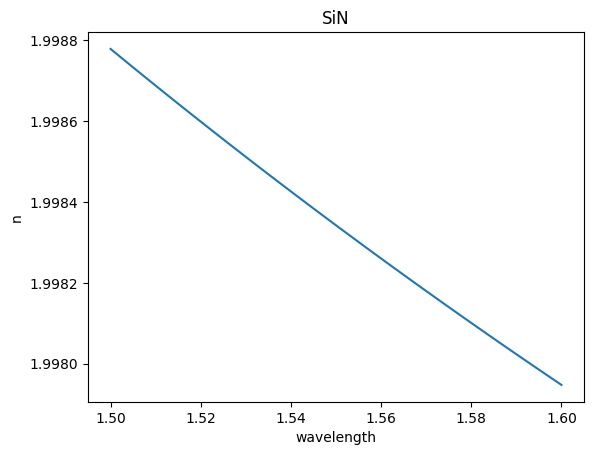
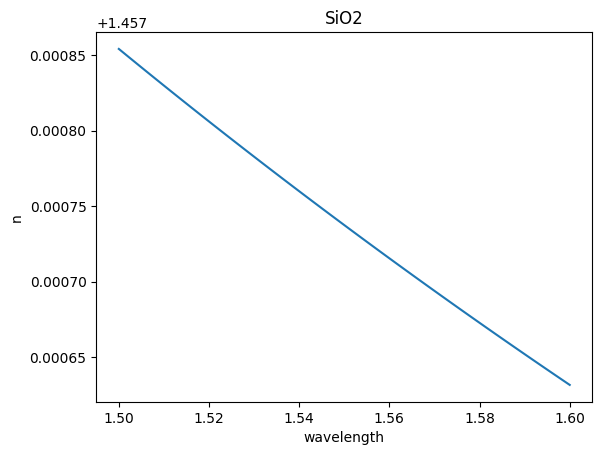
Tidy3d provides you with a material database that also includes dispersive materials.
import gdsfactory as gf
import matplotlib.pyplot as plt
import numpy as np
import tidy3d as td

import gplugins as gp
import gplugins.tidy3d as gt
from gplugins import plot
from gplugins.common.config import PATH
gt.material_name_to_medium
{'si': Si, 'sio2': SiO2, 'sin': SiN}
nm = 1e-3
wavelength = np.linspace(1500, 1600) * nm
f = td.C_0 / wavelength
eps_complex = td.material_library["cSi"]["Li1993_293K"].eps_model(f)
n, k = td.Medium.eps_complex_to_nk(eps_complex)
plt.plot(wavelength, n)
plt.title("cSi crystalline silicon")
plt.xlabel("wavelength")
plt.ylabel("n")
Text(0, 0.5, 'n')
eps_complex = td.material_library["Si3N4"]["Luke2015PMLStable"].eps_model(f)
n, k = td.Medium.eps_complex_to_nk(eps_complex)
plt.plot(wavelength, n)
plt.title("SiN")
plt.xlabel("wavelength")
plt.ylabel("n")
Text(0, 0.5, 'n')
eps_complex = td.material_library["SiO2"]["Horiba"].eps_model(f)
n, k = td.Medium.eps_complex_to_nk(eps_complex)
plt.plot(wavelength, n)
plt.title("SiO2")
plt.xlabel("wavelength")
plt.ylabel("n")
Text(0, 0.5, 'n')
Component Modeler#
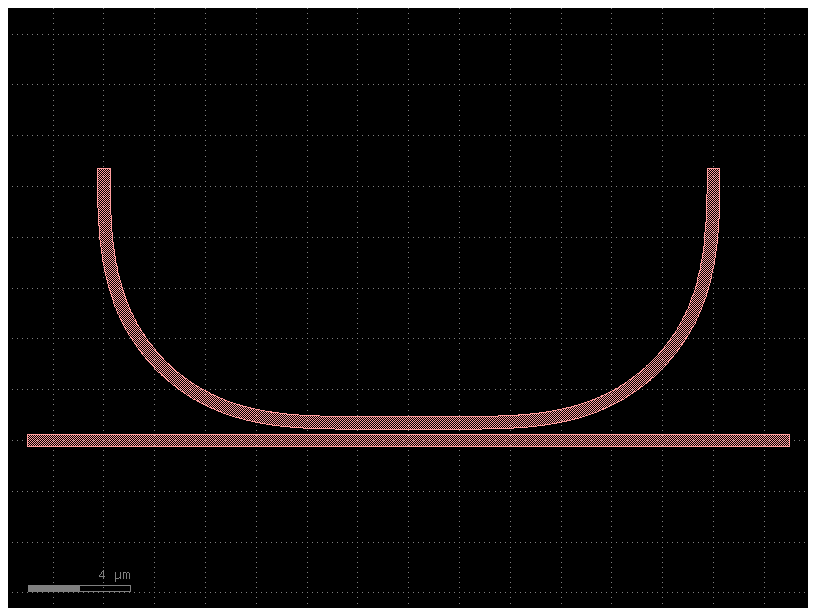
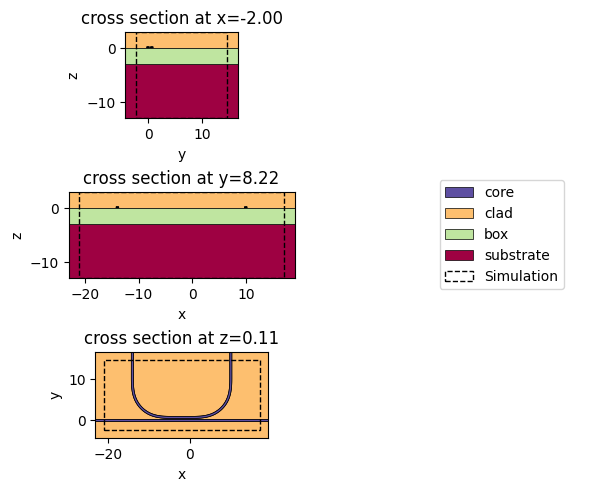
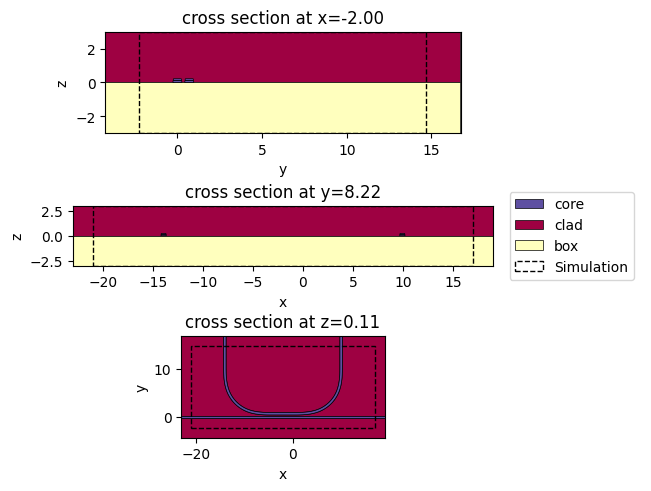
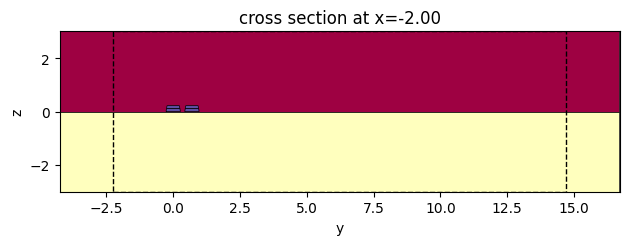
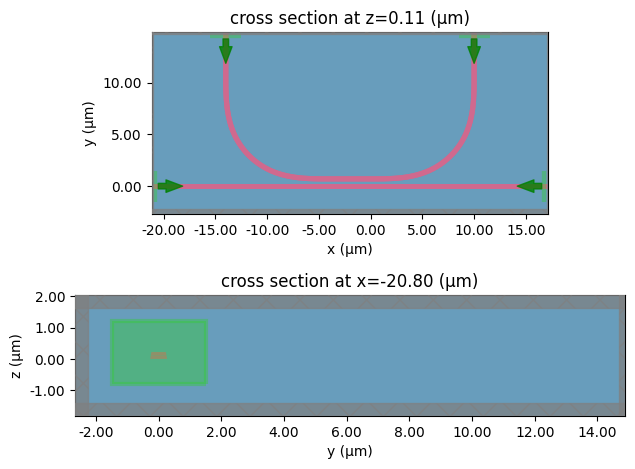
You can easily convert a gdsfactory planar Component into a tidy3d simulation and make sure the simulation looks correct before running it
from gdsfactory.generic_tech import LAYER_STACK, get_generic_pdk

pdk = get_generic_pdk()
pdk.activate()

component = gf.components.coupler_ring()
component.plot()
# define a mapping of pdk material names to tidy3d medium objects
mapping = {
    "si": td.Medium(name="Si", permittivity=3.47**2),
    "sio2": td.Medium(name="SiO2", permittivity=1.47**2),
}

# setup the tidy3d component
c = gt.Tidy3DComponent(
    component=component,
    layer_stack=LAYER_STACK,
    material_mapping=mapping,
    pad_xy_inner=2.0,
    pad_xy_outer=2.0,
    pad_z_inner=0,
    pad_z_outer=0,
    extend_ports=2.0,
)

# plot the component and the layerstack
fig = plt.figure(constrained_layout=True)
gs = fig.add_gridspec(ncols=2, nrows=3, width_ratios=(3, 1))
ax0 = fig.add_subplot(gs[0, 0])
ax1 = fig.add_subplot(gs[1, 0])
ax2 = fig.add_subplot(gs[2, 0])
axl = fig.add_subplot(gs[1, 1])
c.plot_slice(x="core", ax=ax0)
c.plot_slice(y="core", ax=ax1)
c.plot_slice(z="core", ax=ax2)
axl.legend(*ax0.get_legend_handles_labels(), loc="center")
axl.axis("off")
plt.show()
LAYER_STACK.layers.pop("substrate", None)

# setup the tidy3d component
c = gt.Tidy3DComponent(
    component=component,
    layer_stack=LAYER_STACK,
    material_mapping=mapping,
    pad_xy_inner=2.0,
    pad_xy_outer=2.0,
    pad_z_inner=0,
    pad_z_outer=0,
    extend_ports=2.0,
)

# plot the component and the layerstack
fig = plt.figure(constrained_layout=True)
gs = fig.add_gridspec(ncols=2, nrows=3, width_ratios=(3, 1))
ax0 = fig.add_subplot(gs[0, 0])
ax1 = fig.add_subplot(gs[1, 0])
ax2 = fig.add_subplot(gs[2, 0])
axl = fig.add_subplot(gs[1, 1])
c.plot_slice(x="core", ax=ax0)
c.plot_slice(y="core", ax=ax1)
c.plot_slice(z="core", ax=ax2)
axl.legend(*ax0.get_legend_handles_labels(), loc="center")
axl.axis("off")
plt.show()
c.plot_slice(x="core")
<Axes: title={'center': 'cross section at x=-2.00'}, xlabel='y', ylabel='z'>
# initialize the tidy3d ComponentModeler
modeler = c.get_component_modeler(
    center_z="core", port_size_mult=(6, 4), sim_size_z=3.0
)

# we can plot the tidy3d simulation setup
fig, ax = plt.subplots(2, 1)
modeler.plot_sim(z=c.get_layer_center("core")[2], ax=ax[0])
modeler.plot_sim(x=c.ports[0].dcenter[0], ax=ax[1])
fig.tight_layout()
plt.show()
Write S-parameters#
The most useful function is gt.write_sparameters which allows you to:
leverage a file cache to avoid running the same simulation twice.
plot_simulation and modes before running
run in 2D or 3D
file cache#
write_sparameters automatically will write your Sparameters in your home directory. By default uses a hidden folder in your home directory dirpath=~/.gdsfactory/sparameters.
If simulation is found it will load it automatically, if not it will run it and write the Sparameters to filepath
You can also specify a particular filepath to store simulations and load Sparameters from:
sp = gt.write_sparameters(
    component,
    filepath=PATH.sparameters_repo / "coupler_ring_2d.npz",
    sim_size_z=0,
    center_z="core",
)
16:14:52 UTC WARNING: 'simulation.structures[1]' is outside of the simulation
             domain.
             WARNING: 'simulation.structures[1]' is outside of the simulation
             domain.
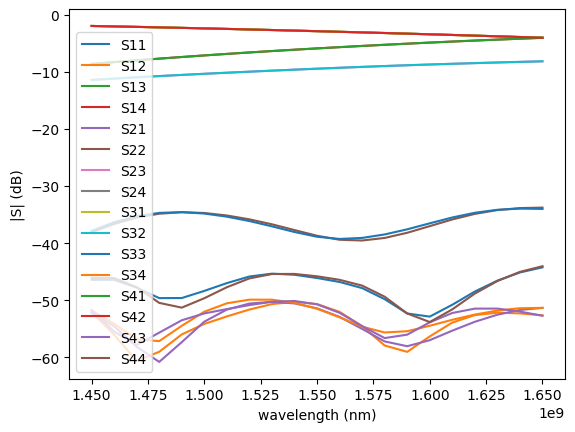
Simulation loaded from PosixPath('/home/runner/work/gplugins/gplugins/test-data/sp/coupler_ring_2d.npz')
gp.plot.plot_sparameters(sp)
Plot Simulations#
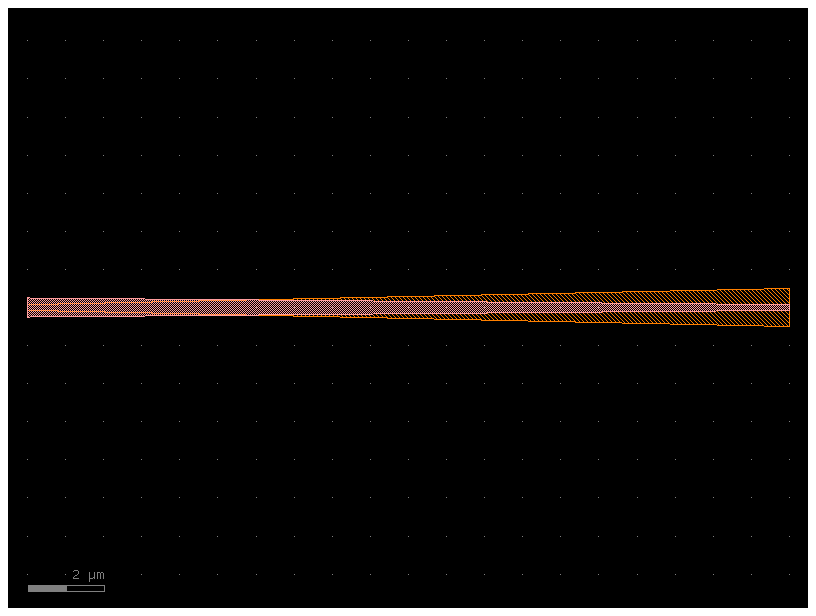
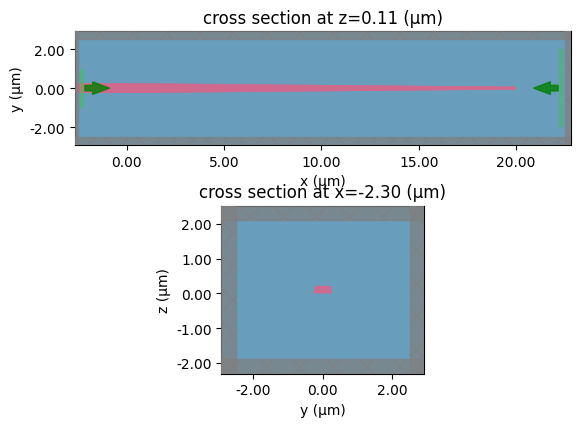
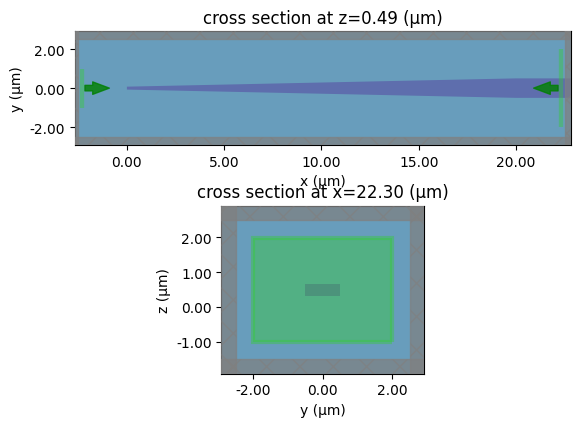
When setting up a simulation it’s important to check if simulation and modes looks correct.
c = gf.components.taper_sc_nc()
c.plot()
sp = gt.write_sparameters(c, plot_simulation_layer_name="core", layer_stack=LAYER_STACK)
# lets plot the fundamental input mode
sp = gt.write_sparameters(
    c, plot_mode_port_name="o1", plot_mode_index=0, layer_stack=LAYER_STACK
)
16:14:53 UTC WARNING: Use the remote mode solver with subpixel averaging for
             better accuracy through 'tidy3d.web.run(...)' or the deprecated
             'tidy3d.plugins.mode.web.run(...)'.

# lets plot the second order input mode
mode_spec = td.ModeSpec(num_modes=2, filter_pol="te")
sp = gt.write_sparameters(
    c,
    plot_mode_port_name="o1",
    plot_mode_index=1,
    layer_stack=LAYER_STACK,
    mode_spec=mode_spec,
)

sp = gt.write_sparameters(
    c,
    plot_simulation_layer_name="nitride",
    plot_simulation_port_index=1,
    layer_stack=LAYER_STACK,
)
# lets plot the output mode
sp = gt.write_sparameters(
    c, plot_mode_port_name="o2", plot_mode_index=0, layer_stack=LAYER_STACK
)

2D#
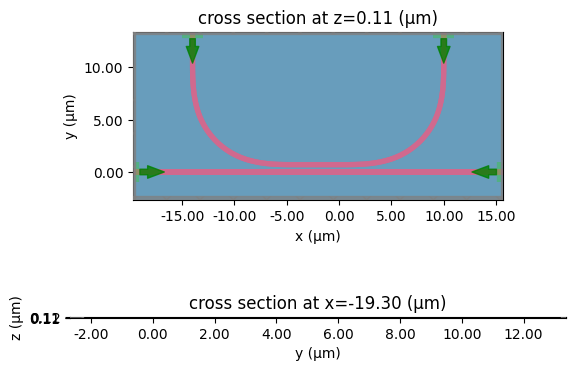
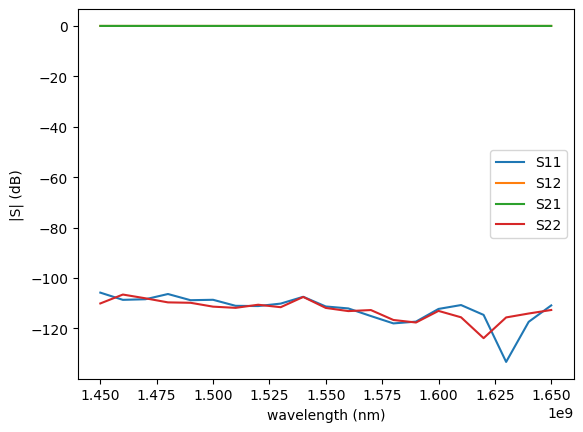
2D simulations take less credits but are also less accurate than 3D. When running in 2D we don’t consider the component thickness in the z dimension.
For running simulations in 2D you need to set sim_size_z = 0.
It is also important that you choose center_z correctly.
sp = gt.write_sparameters(
    component,
    sim_size_z=0,
    layer_stack=LAYER_STACK,
    plot_simulation_layer_name="core",
    center_z="core",
)
16:15:16 UTC WARNING: 'simulation.structures[1]' is outside of the simulation
             domain.
             WARNING: 'simulation.structures[1]' is outside of the simulation
             domain.
             WARNING: 'simulation.structures[1]' is outside of the simulation
             domain.
             WARNING: 'simulation.structures[1]' is outside of the simulation
             domain.
16:15:17 UTC WARNING: 'simulation.structures[1]' is outside of the simulation
             domain.
/home/runner/work/gplugins/gplugins/.venv/lib/python3.11/site-packages/tidy3d/components/scene.py:584: UserWarning: Attempting to set identical low and high ylims makes transformation singular; automatically expanding.
  ax.set_ylim(vlim)
component = gf.components.straight()
sp = gt.write_sparameters(
    component,
    filepath=PATH.sparameters_repo / "straight_2d.npz",
    sim_size_z=0,
    center_z="core",
)
             WARNING: 'simulation.structures[1]' is outside of the simulation
             domain.
             WARNING: 'simulation.structures[1]' is outside of the simulation
             domain.
Simulation loaded from PosixPath('/home/runner/work/gplugins/gplugins/test-data/sp/straight_2d.npz')
gp.plot.plot_sparameters(sp)
3D#
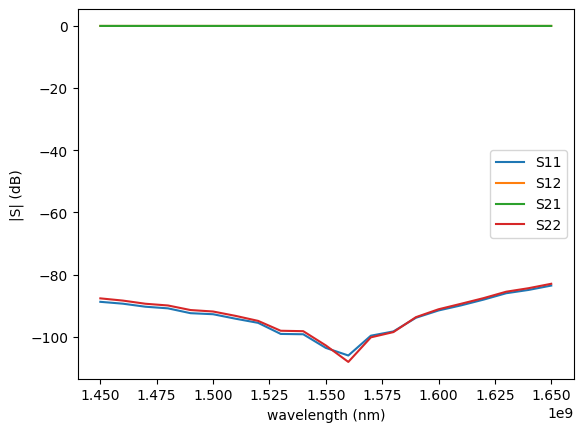
By default all simulations run in 3D unless indicated otherwise. 3D simulations run quite fast thanks to the GPU solver on the server side hosted by tidy3d cloud.
c = gf.components.straight(length=2)
sp = gt.write_sparameters(
    c, filepath=PATH.sparameters_repo / "straight_3d.npz", sim_size_z=4
)
gp.plot.plot_sparameters(sp)
Simulation loaded from PosixPath('/home/runner/work/gplugins/gplugins/test-data/sp/straight_3d.npz')
Erosion / dilation#
component = gf.components.straight(length=0.1)
sp = gt.write_sparameters(
    component, layer_stack=LAYER_STACK, plot_simulation_layer_name="core", dilation=0
)
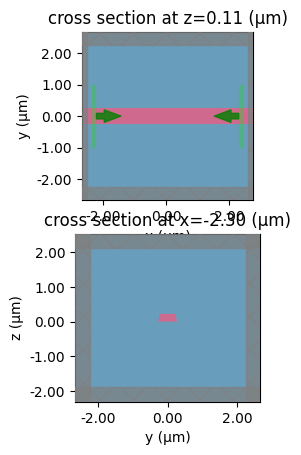
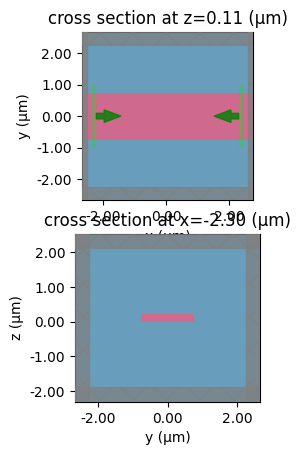
A dilation = 0.5 makes a 0.5um waveguide 0.75um
0.5 * 0.8
0.4
component = gf.components.straight(length=0.1)
sp = gt.write_sparameters(
    component, layer_stack=LAYER_STACK, plot_simulation_layer_name="core", dilation=0.5
)
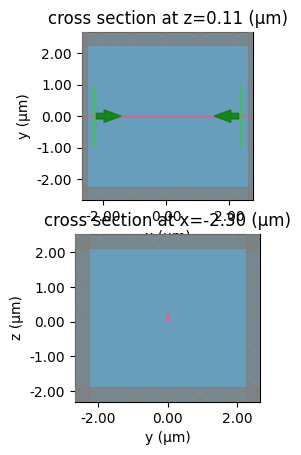
A dilation = -0.2 makes a 0.5um eroded down to 0.1um
0.2 * 0.5
0.1
component = gf.components.straight(length=0.1)
sp = gt.write_sparameters(
    component, layer_stack=LAYER_STACK, plot_simulation_layer_name="core", dilation=-0.2
)
Plot monitors#
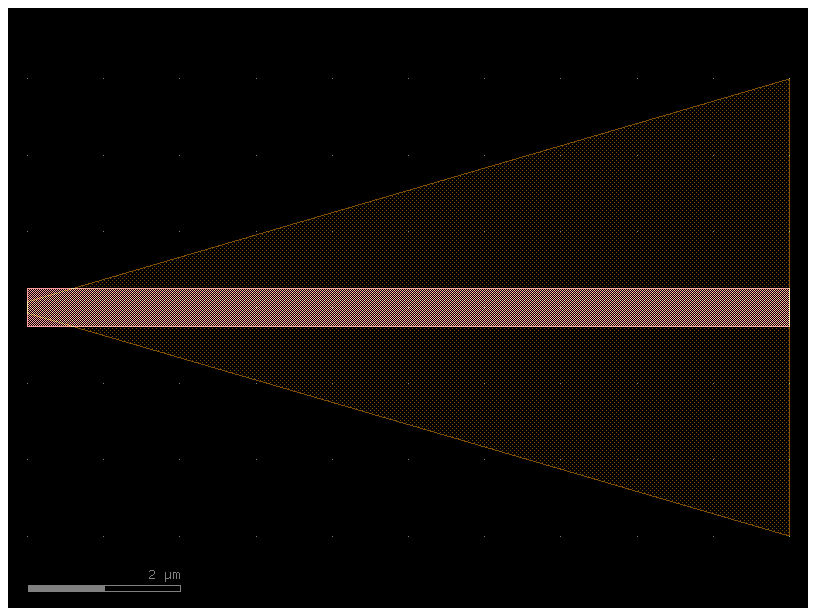
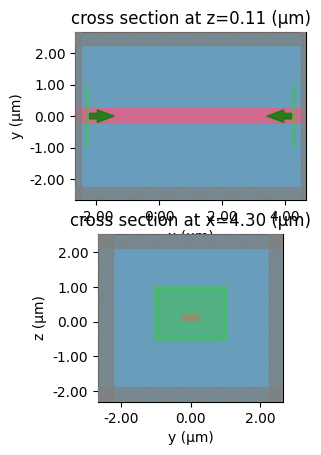
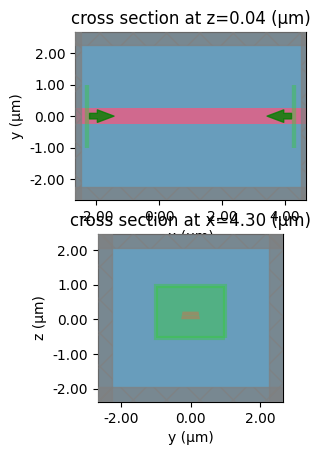
component = gf.components.taper_strip_to_ridge(length=10)
component.plot()
sp = gt.write_sparameters(
    c,
    plot_simulation_layer_name="core",
    plot_simulation_port_index=0,
    layer_stack=LAYER_STACK,
)
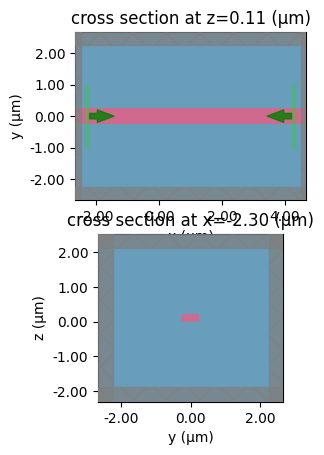
sp = gt.write_sparameters(
    c,
    plot_simulation_layer_name="core",
    plot_simulation_port_index=1,
    layer_stack=LAYER_STACK,
)
sp = gt.write_sparameters(
    c,
    plot_simulation_layer_name="slab90",
    plot_simulation_port_index=1,
    layer_stack=LAYER_STACK,
)
components = [
    "bend_euler",
    "bend_s",
    "coupler",
    "coupler_ring",
    "crossing",
    "mmi1x2",
    "mmi2x2",
    "taper",
    "straight",
]

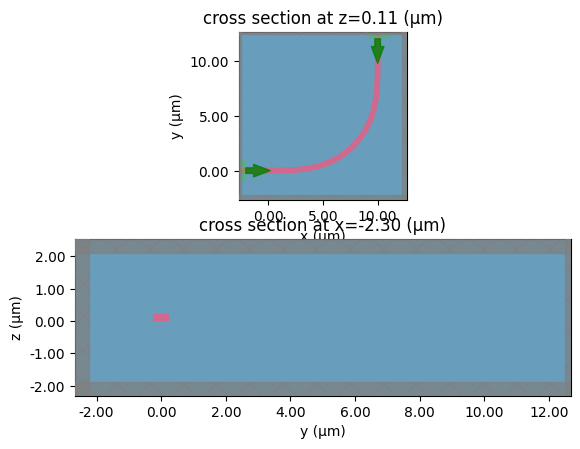
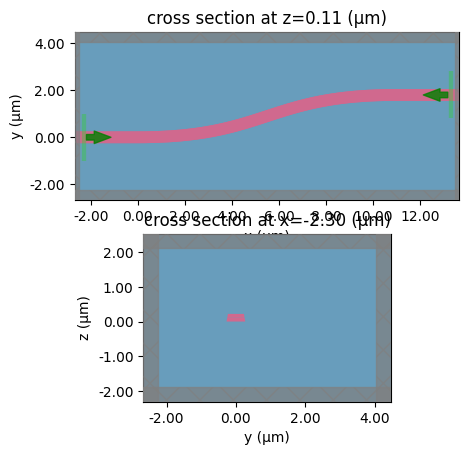
for component_name in components:
    print(component_name)
    component = gf.get_component(component_name)
    gt.write_sparameters(
        component=component,
        layer_stack=LAYER_STACK,
        plot_simulation_layer_name="core",
        plot_simulation_port_index=0,
    )
bend_euler
bend_s
coupler
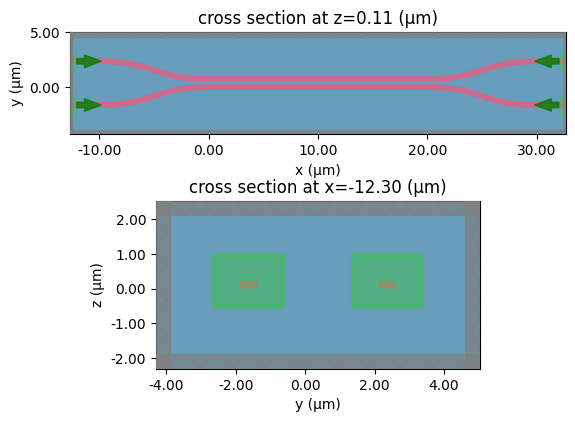
coupler_ring
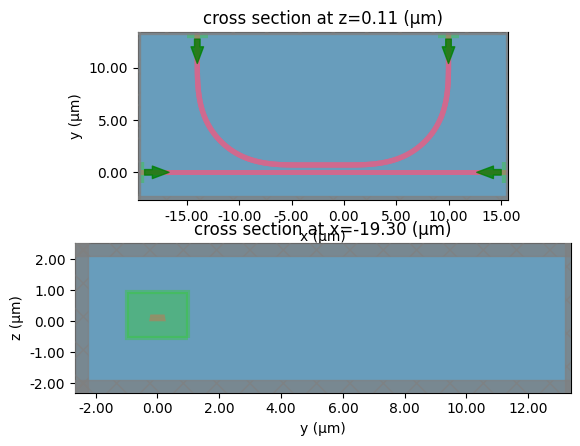
crossing
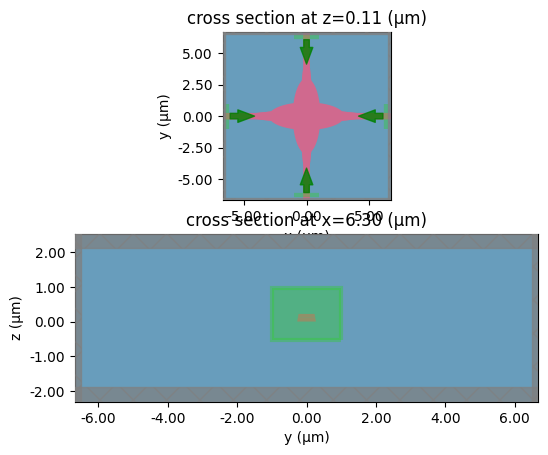
mmi1x2
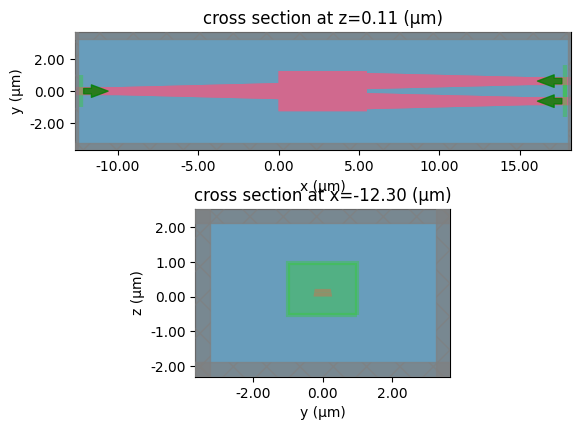
mmi2x2
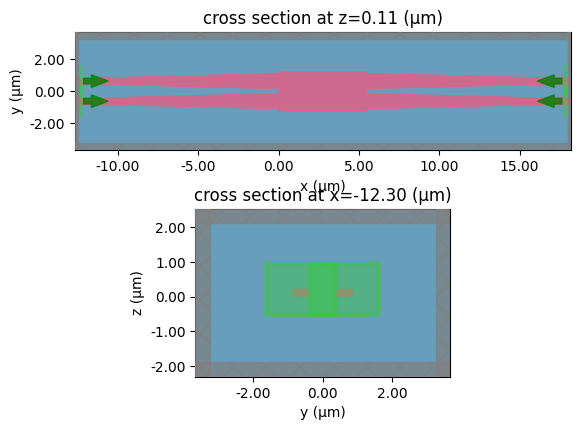
taper
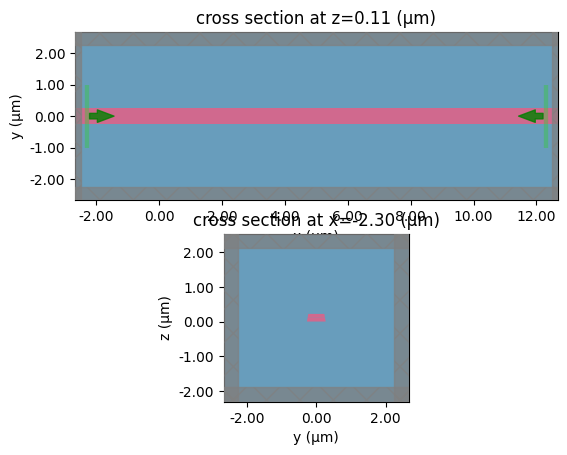
straight

c = gf.components.bend_circular(radius=5)
s = gt.write_sparameters(
    c,
    layer_stack=LAYER_STACK,
    plot_simulation_layer_name="core",
    plot_simulation_port_index=0,
)
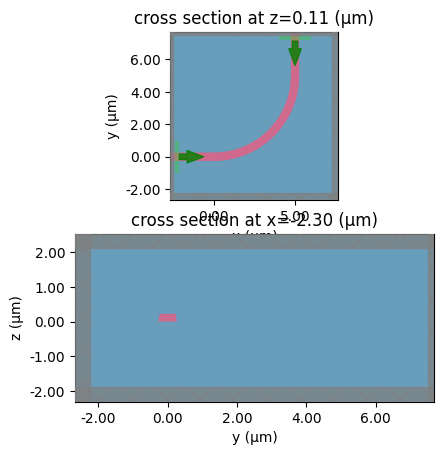
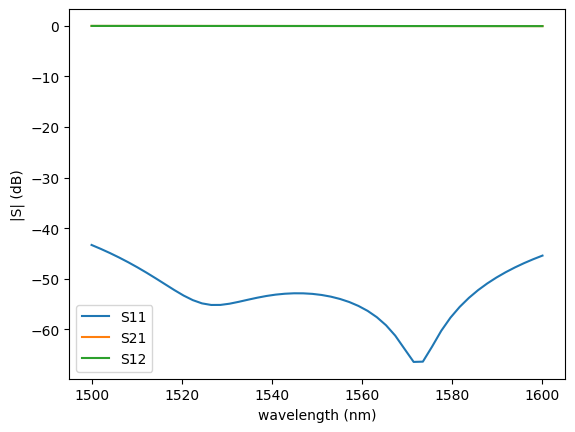
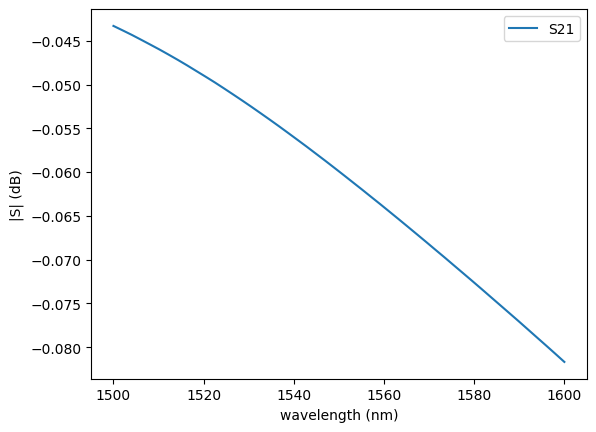
For a 2 port reciprocal passive component you can always assume s21 = s12
Another approximation you can make for planar devices is that s11 = s22, which saves 1 extra simulation.
This approximation only works well for straight and bends.
We call this 1x1 port symmetry
sp = np.load(
    PATH.sparameters_repo / "bend_circular_radius2_9d7742b34c224827aeae808dc986308e.npz"
)
plot.plot_sparameters(sp)
plot.plot_sparameters(sp, keys=("o2@0,o1@0",))
c = gf.components.mmi1x2()
s = gt.write_sparameters(
    c,
    layer_stack=LAYER_STACK,
    plot_simulation_layer_name="core",
    plot_simulation_port_index=0,
)

# sp = gt.write_sparameters(c)
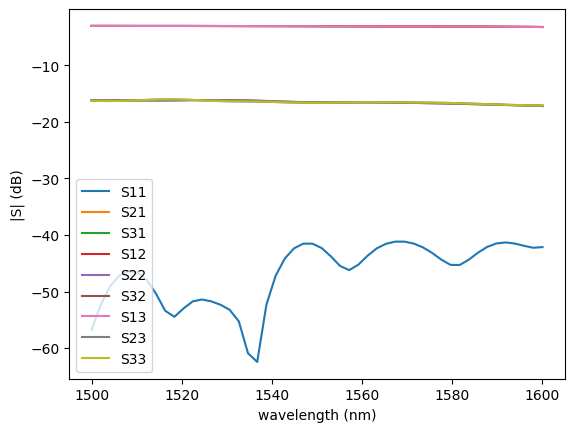
sp = np.load(PATH.sparameters_repo / "mmi1x2_507de731d50770de9096ac9f23321daa.npz")
plot.plot_sparameters(sp)
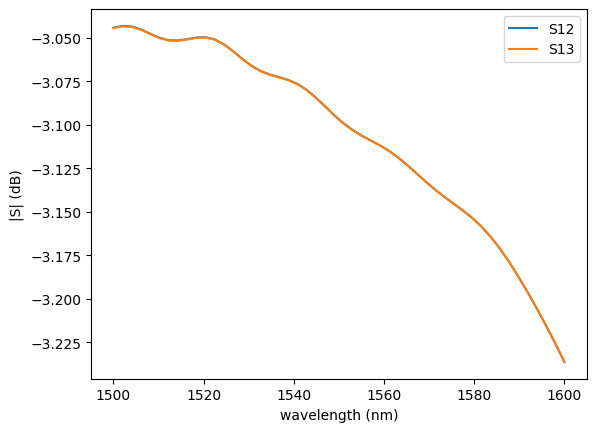
plot.plot_sparameters(sp, keys=("o1@0,o2@0", "o1@0,o3@0"))
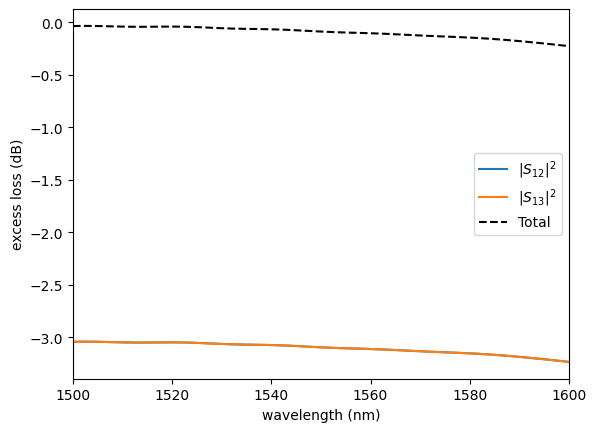
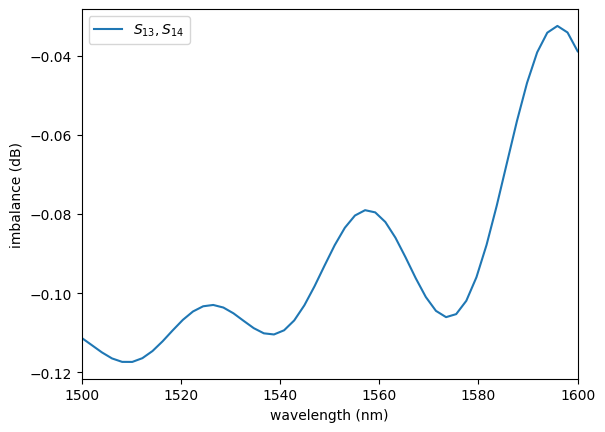
plot.plot_loss1x2(sp)
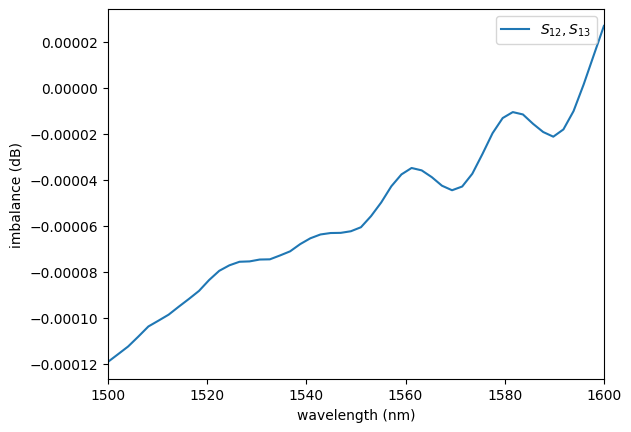
plot.plot_imbalance1x2(sp)
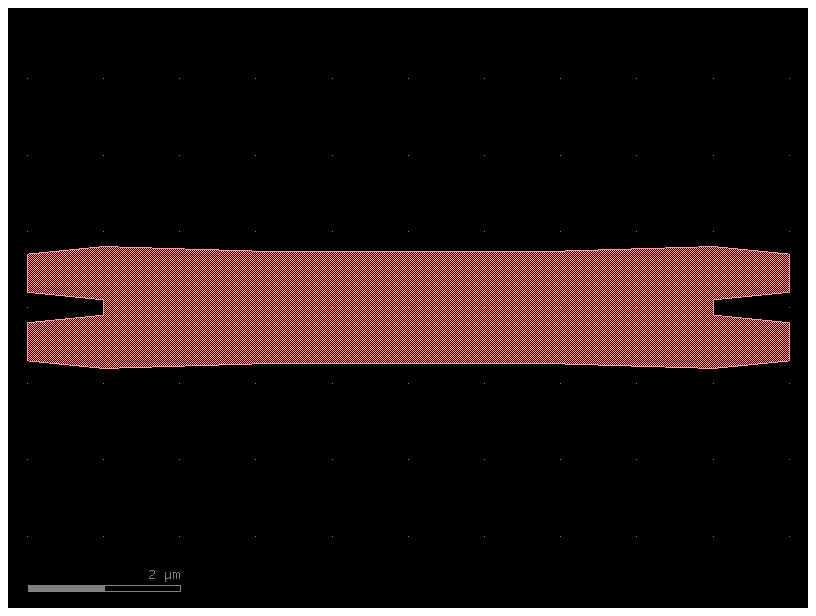
c = gf.components.mmi2x2_with_sbend(with_sbend=False)
c.plot()
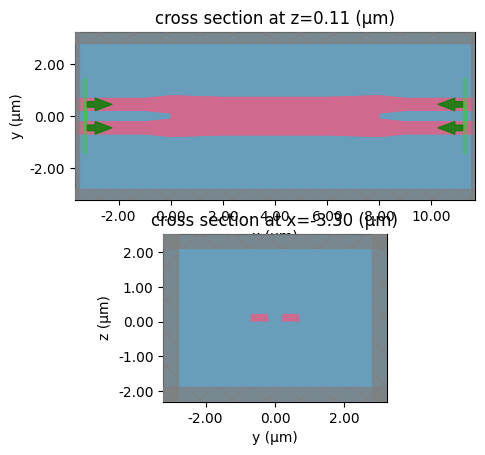
sp = gt.write_sparameters(
    c,
    layer_stack=LAYER_STACK,
    plot_simulation_layer_name="core",
    plot_simulation_port_index=0,
)
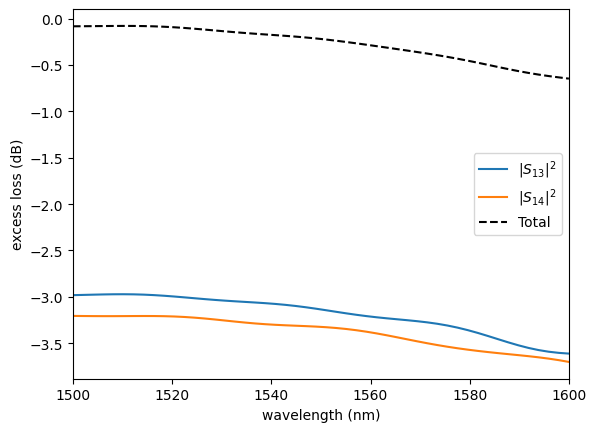
# sp = gt.write_sparameters(c, filepath=PATH.sparameters_repo / 'mmi2x2_without_sbend.npz')
sp = np.load(PATH.sparameters_repo / "mmi2x2_without_sbend.npz")
plot.plot_loss2x2(sp)
plot.plot_imbalance2x2(sp)
get_simulation_grating_coupler#
You can also expand the planar component simulations to simulate an out-of-plane grating coupler.
The following simulations run in 2D but can also run in 3D.
help(gt.get_simulation_grating_coupler)
Help on function get_simulation_grating_coupler in module gplugins.tidy3d.get_simulation_grating_coupler:

get_simulation_grating_coupler(component: 'Component', port_extension: 'float' = 10.0, layer_stack: 'LayerStack | None' = None, exclude_layers: 'LayerSpecs | None' = None, thickness_pml: 'float' = 1.0, xmargin: 'float' = 0, ymargin: 'float' = 0, xmargin_left: 'float' = 0, xmargin_right: 'float' = 0, ymargin_top: 'float' = 0, ymargin_bot: 'float' = 0, zmargin: 'float' = 1.0, clad_material: 'str' = 'sio2', box_material: 'str' = 'sio2', box_thickness: 'float' = 3.0, substrate_material: 'str' = 'si', port_waveguide_name: 'str' = 'o1', port_margin: 'float' = 0.5, port_waveguide_offset: 'float' = 0.1, wavelength: 'float' = 1.55, wavelength_start: 'float' = 1.2, wavelength_stop: 'float' = 1.8, wavelength_points: 'int' = 256, plot_modes: 'bool' = False, num_modes: 'int' = 2, run_time_ps: 'float' = 10.0, fiber_port_prefix: 'str' = 'o2', fiber_xoffset: 'float' = 0, fiber_z: 'float' = 2, fiber_mfd: 'float' = 10.4, fiber_angle_deg: 'float' = 20.0, material_name_to_tidy3d: 'dict[str, str] | None' = None, is_3d: 'bool' = True, with_all_monitors: 'bool' = False, boundary_spec: 'td.BoundarySpec | None' = None, grid_spec: 'td.GridSpec | None' = None, sidewall_angle_deg: 'float' = 0, dilation: 'float' = 0.0, cross_section: 'CrossSectionSpec | None' = None, **kwargs) -> 'td.Simulation'
    Returns Simulation object from a gdsfactory grating coupler component.

    Injects a Gaussian beam from above and monitors the transmission into the waveguide.

    based on grating coupler example
    https://docs.simulation.cloud/projects/tidy3d/en/latest/notebooks/GratingCoupler.html

    .. code::

         top view
              ________________________________
             |                               |
             | xmargin_left                  |
             |<------>                       |
             |           ________________    |
             |          /   |  |  |  |  |    |
             |         /    |  |  |  |  |    |
             |=========     |  |  |  |  |    |
             |         \    |  |  |  |  |    |
             |   _ _ _ _\___|__|__|__|__|    |
             |   |                       <-->|
             |   |ymargin_bot   xmargin_right|
             |   |                           |
             |___|___________________________|


        side view

              fiber_xoffset
                 |<--->|
            fiber_port_name
                 |
                         fiber_angle_deg > 0
                        |  /
                        | /
                        |/
                 /              /       |
                /  fiber_mfd   /        |
               /<------------>/    _ _ _| _ _ _ _ _ _ _
                                        |
                   clad_material        | fiber_z
                    _   _   _      _ _ _|_ _ _ _ _ _ _
                   | | | | | |          ||core_thickness
                  _| |_| |_| |__________||___
                                        || |
        waveguide            |          || | slab_thickness
              ____________________ _ _ _||_|_
                             |          |
                   box_material         |box_thickness
              _______________|____ _ _ _|_ _ _ _ _ _ _
                             |          |
                 substrate_material     |substrate_thickness
             ________________|____ _ _ _|_ _ _ _ _ _ _
                             |
        |--------------------|<-------->
                                xmargin

    Args:
        component: gdsfactory Component.
        port_extension: extend ports beyond the PML.
        layer_stack: contains layer to thickness, zmin and material.
            Defaults to active pdk.layer_stack.
        exclude_layers: list of layers to exclude.
        thickness_pml: PML thickness (um).
        xmargin: left/right distance from component to PML.
        xmargin_left: left distance from component to PML.
        xmargin_right: right distance from component to PML.
        ymargin: left/right distance from component to PML.
        ymargin_top: top distance from component to PML.
        ymargin_bot: bottom distance from component to PML.
        zmargin: thickness for cladding above and below core.
        clad_material: material for cladding.
        box_material: material for box.
        substrate_material: material for substrate.
        box_thickness: (um).
        substrate_thickness: (um).
        port_waveguide_name: input port name.
        port_margin: margin on each side of the port.
        port_waveguide_offset: mode solver workaround.
            positive moves source forward, negative moves source backward.
        wavelength: source center wavelength (um).
            if None takes mean between wavelength_start, wavelength_stop
        wavelength_start: in (um).
        wavelength_stop: in (um).
        wavelength_points: number of wavelengths.
        plot_modes: plot source modes.
        num_modes: number of modes to plot.
        run_time_ps: make sure it's sufficient for the fields to decay.
            defaults to 10ps and automatic shutoff stops earlier if needed.
        fiber_port_prefix: port prefix to place fiber source.
        fiber_xoffset: fiber center xoffset to fiber_port_name.
        fiber_z: fiber zoffset from grating zmax.
        fiber_mfd: fiber mode field diameter (um). 10.4 for Cband and 9.2um for Oband.
        fiber_angle_deg: fiber_angle in degrees with respect to normal.
            Positive for west facing, Negative for east facing sources.
        material_name_to_tidy3d: dispersive materials have a wavelength
            dependent index. Maps layer_stack names with tidy3d material database names.
        is_3d: if False collapses the Y direction for a 2D simulation.
        with_all_monitors: True includes field monitors which increase results filesize.
        grid_spec: defaults to automatic td.GridSpec.auto(wavelength=wavelength)
            td.GridSpec.uniform(dl=20*nm)
            td.GridSpec(
                grid_x = td.UniformGrid(dl=0.04),
                grid_y = td.AutoGrid(min_steps_per_wvl=20),
                grid_z = td.AutoGrid(min_steps_per_wvl=20),
                wavelength=wavelength,
                override_structures=[refine_box]
            )
        boundary_spec: Specification of boundary conditions along each dimension.
            Defaults to td.BoundarySpec.all_sides(boundary=td.PML())
        sidewall_angle_deg : float = 0
            Angle of the sidewall.
            ``sidewall_angle=0`` (default) specifies vertical wall,
            while ``0<sidewall_angle_deg<90`` for the base to be larger than the top.
        dilation: float = 0.0
            Dilation of the polygon in the base by shifting each edge along its
            normal outwards direction by a distance;
            a negative value corresponds to erosion.
        cross_section: optional cross_section to extend ports beyond PML.
        kwargs: Additional keyword arguments to pass to the Simulation constructor.

    Keyword Args:
        symmetry: Define Symmetries.
            Tuple of integers defining reflection symmetry across a plane
            bisecting the simulation domain normal to the x-, y-, and z-axis
            at the simulation center of each axis, respectively.
            Each element can be ``0`` (no symmetry), ``1`` (even, i.e. 'PMC' symmetry) or
            ``-1`` (odd, i.e. 'PEC' symmetry).
            Note that the vectorial nature of the fields must be taken into account to correctly
            determine the symmetry value.
        medium: Background medium of simulation, defaults to vacuum if not specified.
        shutoff: shutoff condition
            Ratio of the instantaneous integrated E-field intensity to the maximum value
            at which the simulation will automatically terminate time stepping.
            Used to prevent extraneous run time of simulations with fully decayed fields.
            Set to ``0`` to disable this feature.
        subpixel: subpixel averaging.If ``True``, uses subpixel averaging of the permittivity
        based on structure definition, resulting in much higher accuracy for a given grid size.
        courant: courant factor.
            Courant stability factor, controls time step to spatial step ratio.
            Lower values lead to more stable simulations for dispersive materials,
            but result in longer simulation times.
        version: String specifying the front end version number.

    .. code::

        import matplotlib.pyplot as plt
        import gdsfactory as gf
        import gplugins.tidy3d as gt

        c = gf.components.grating_coupler_elliptical_arbitrary(
            widths=[0.343] * 25, gaps=[0.345] * 25
        )
        sim = gt.get_simulation(c)
        gt.plot_simulation(sim)
c = (
    gf.components.grating_coupler_elliptical_lumerical()
)  # inverse design grating apodized
fiber_angle_deg = 5
s = gt.get_simulation_grating_coupler(
    c, is_3d=False, fiber_angle_deg=fiber_angle_deg, fiber_xoffset=0
)
f = gt.plot_simulation(s)
Adding layer (1, 0), zmin=0.0, zmax=0.22
Adding layer (2, 0), zmin=0.0, zmax=0.07
Adding layer (2, 0), zmin=0.0, zmax=0.15
16:15:25 UTC WARNING: The medium associated with structures[1] has a frequency
             range: (1.6926e14, 12.0899e14) (Hz) that does not fully cover the
             frequencies contained in monitors[0]. This can cause inaccuracies
             in the recorded results.
WARNING: Suppressed 1 WARNING message.
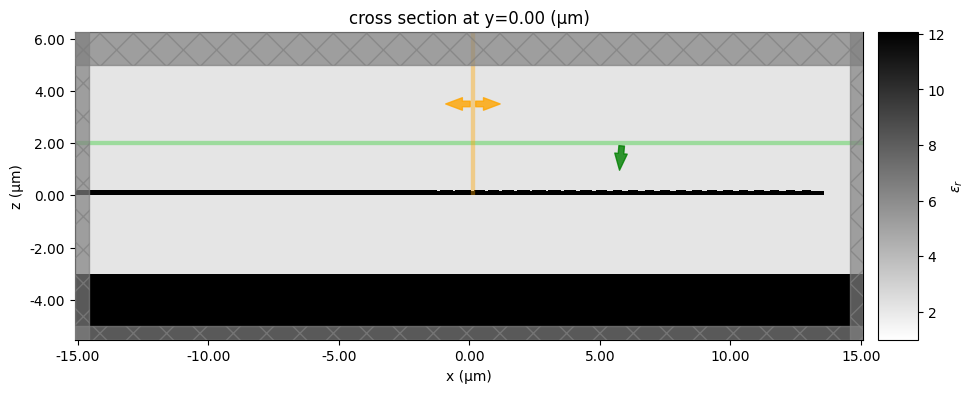
f = c.plot()
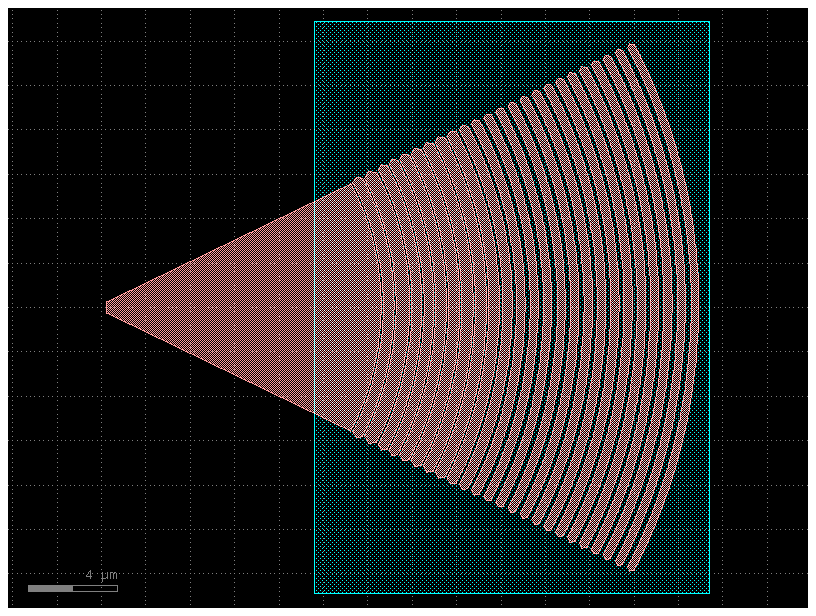
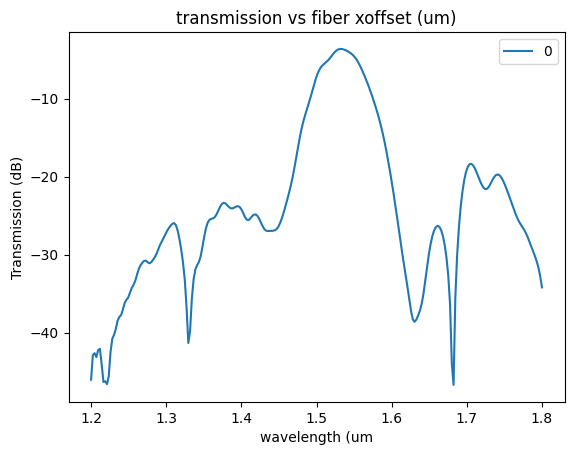
Lets compare the xtolerance of a constant pitch vs an apodized grating.
We run simulations in 2D for faster.
Lets simulate 2 different grating couplers:
apodized inverse design example from lumerical website (5 degrees fiber angle)
constant pitch grating from gdsfactory generic PDK (20 degrees fiber angle)
sim = gt.get_simulation_grating_coupler(
    c, is_3d=False, fiber_angle_deg=fiber_angle_deg, fiber_xoffset=0
)
f = gt.plot_simulation(sim)
Adding layer (1, 0), zmin=0.0, zmax=0.22
Adding layer (2, 0), zmin=0.0, zmax=0.07
Adding layer (2, 0), zmin=0.0, zmax=0.15
16:15:26 UTC WARNING: The medium associated with structures[1] has a frequency
             range: (1.6926e14, 12.0899e14) (Hz) that does not fully cover the
             frequencies contained in monitors[0]. This can cause inaccuracies
             in the recorded results.
WARNING: Suppressed 1 WARNING message.

sim = gt.get_simulation_grating_coupler(
    c, is_3d=False, fiber_angle_deg=fiber_angle_deg, fiber_xoffset=0
)
f = gt.plot_simulation(sim)
Adding layer (1, 0), zmin=0.0, zmax=0.22
Adding layer (2, 0), zmin=0.0, zmax=0.07
Adding layer (2, 0), zmin=0.0, zmax=0.15
             WARNING: The medium associated with structures[1] has a frequency
             range: (1.6926e14, 12.0899e14) (Hz) that does not fully cover the
             frequencies contained in monitors[0]. This can cause inaccuracies
             in the recorded results.
WARNING: Suppressed 1 WARNING message.

offsets = np.arange(-5, 6, 5)
offsets = [-10, -5, 0]
offsets = [0]
dfs = [
    gt.write_sparameters_grating_coupler(
        component=c,
        is_3d=False,
        fiber_angle_deg=fiber_angle_deg,
        fiber_xoffset=fiber_xoffset,
        filepath=PATH.sparameters_repo / f"gc_offset{fiber_xoffset}",
    )
    for fiber_xoffset in offsets
]
def log(x):
    return 20 * np.log10(x)
for offset in offsets:
    sp = gt.write_sparameters_grating_coupler(
        c,
        is_3d=False,
        fiber_angle_deg=fiber_angle_deg,
        fiber_xoffset=offset,
        filepath=PATH.sparameters_repo / f"gc_offset{offset}",
    )
    plt.plot(
        sp["wavelengths"], 20 * np.log10(np.abs(sp["o2@0,o1@0"])), label=str(offset)
    )

plt.xlabel("wavelength (um")
plt.ylabel("Transmission (dB)")
plt.title("transmission vs fiber xoffset (um)")
plt.legend()
<matplotlib.legend.Legend at 0x7f3d096de950>
sp.keys()
dict_keys(['wavelengths', 'o1@0,o1@0', 'o2@0,o2@0', 'o1@0,o2@0', 'o2@0,o1@0'])
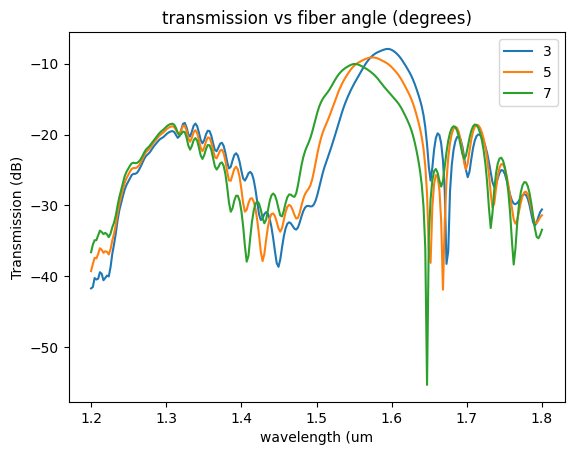
fiber_angles = [3, 5, 7]
dfs = [
    gt.write_sparameters_grating_coupler(
        component=c,
        is_3d=False,
        fiber_angle_deg=fiber_angle_deg,
        filepath=PATH.sparameters_repo / f"gc_angle{fiber_angle_deg}",
    )
    for fiber_angle_deg in fiber_angles
]
for fiber_angle_deg in fiber_angles:
    sp = gt.write_sparameters_grating_coupler(
        c,
        is_3d=False,
        fiber_angle_deg=fiber_angle_deg,
        filepath=PATH.sparameters_repo / f"gc_angle{fiber_angle_deg}",
    )
    plt.plot(
        sp["wavelengths"],
        20 * np.log10(np.abs(sp["o2@0,o1@0"])),
        label=str(fiber_angle_deg),
    )

plt.xlabel("wavelength (um")
plt.ylabel("Transmission (dB)")
plt.title("transmission vs fiber angle (degrees)")
plt.legend()
<matplotlib.legend.Legend at 0x7f3d0977c210>
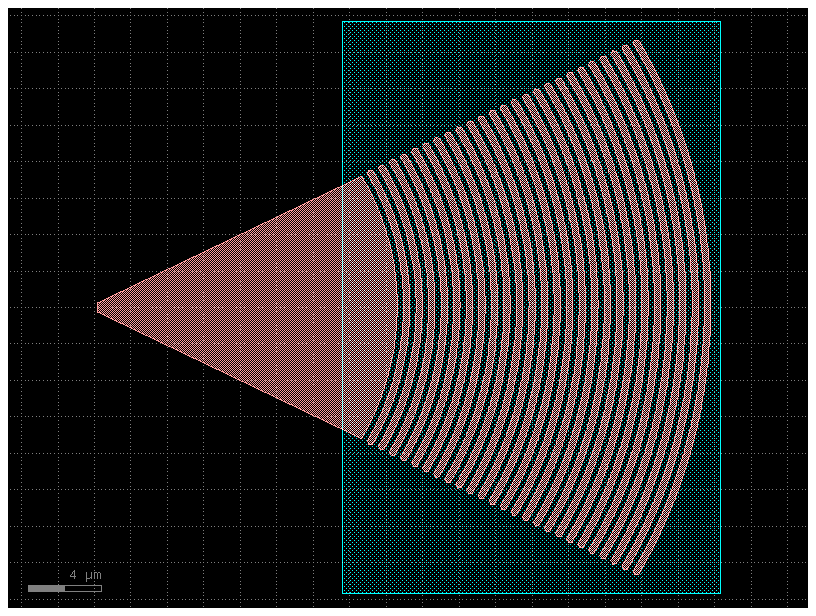
c = gf.components.grating_coupler_elliptical_arbitrary(
    widths=(0.343,) * 25, gaps=(0.345,) * 25
)
f = c.plot()
fiber_angle_deg = 20
sim = gt.get_simulation_grating_coupler(
    c, is_3d=False, fiber_angle_deg=fiber_angle_deg, fiber_xoffset=0
)
f = gt.plot_simulation(sim, figsize=(22, 8))
Adding layer (1, 0), zmin=0.0, zmax=0.22
Adding layer (2, 0), zmin=0.0, zmax=0.07
Adding layer (2, 0), zmin=0.0, zmax=0.15
16:15:27 UTC WARNING: The medium associated with structures[1] has a frequency
             range: (1.6926e14, 12.0899e14) (Hz) that does not fully cover the
             frequencies contained in monitors[0]. This can cause inaccuracies
             in the recorded results.
WARNING: Suppressed 1 WARNING message.

offsets = [0]
offsets
[0]
dfs = [
    gt.write_sparameters_grating_coupler(
        component=c,
        is_3d=False,
        fiber_angle_deg=fiber_angle_deg,
        fiber_xoffset=fiber_xoffset,
        filepath=PATH.sparameters_repo / f"gc_offset{offset}",
    )
    for fiber_xoffset in offsets
]
port_name = c.ports[1].name

for offset in offsets:
    sp = gt.write_sparameters_grating_coupler(
        c,
        is_3d=False,
        fiber_angle_deg=fiber_angle_deg,
        fiber_xoffset=offset,
        filepath=PATH.sparameters_repo / f"gc_offset{offset}",
    )
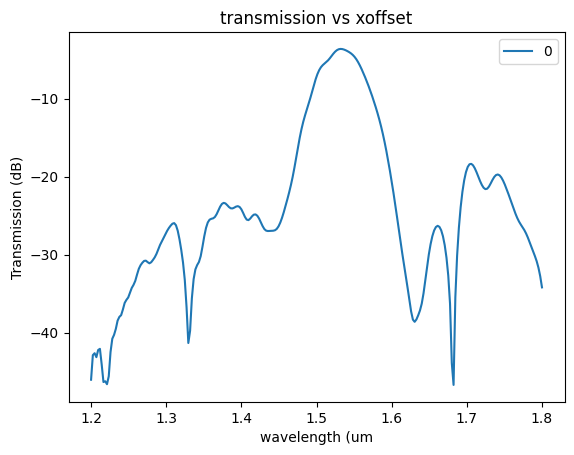
    plt.plot(
        sp["wavelengths"],
        20 * np.log10(np.abs(sp["o2@0,o1@0"])),
        label=str(offset),
    )

plt.xlabel("wavelength (um")
plt.ylabel("Transmission (dB)")
plt.title("transmission vs xoffset")
plt.legend()
<matplotlib.legend.Legend at 0x7f3d0c091250>
Run jobs in parallel#
You can run multiple simulations in parallel on separate threads.
Only when you sp.result() you will wait for the simulations to finish.
c = gf.components.grating_coupler_elliptical_lumerical()
fiber_angles = [3, 5, 7]
jobs = [
    dict(
        component=c,
        is_3d=False,
        fiber_angle_deg=fiber_angle_deg,
        filepath=PATH.sparameters_repo / f"gc_angle{fiber_angle_deg}",
    )
    for fiber_angle_deg in fiber_angles
]
sps = gt.write_sparameters_grating_coupler_batch(jobs)
for sp, fiber_angle_deg in zip(sps, fiber_angles):
    sp = sp.result()
    plt.plot(
        sp["wavelengths"],
        20 * np.log10(np.abs(sp["o2@0,o1@0"])),
        label=str(fiber_angle_deg),
    )

plt.xlabel("wavelength (um")
plt.ylabel("Transmission (dB)")
plt.title("transmission vs fiber angle (degrees)")
plt.legend()
<matplotlib.legend.Legend at 0x7f3d01c96950>

