Workflow#
You’ll need 2 windows:
A text editor or IDE (Visual Studio Code, Pycharm, Spyder, neovim, Atom, Jupyterlab …)
Klayout to Visualize the GDS files. With the
kliveklayout package for showing GDS files when you run. Tools -> Manage PackagesComponent.show()
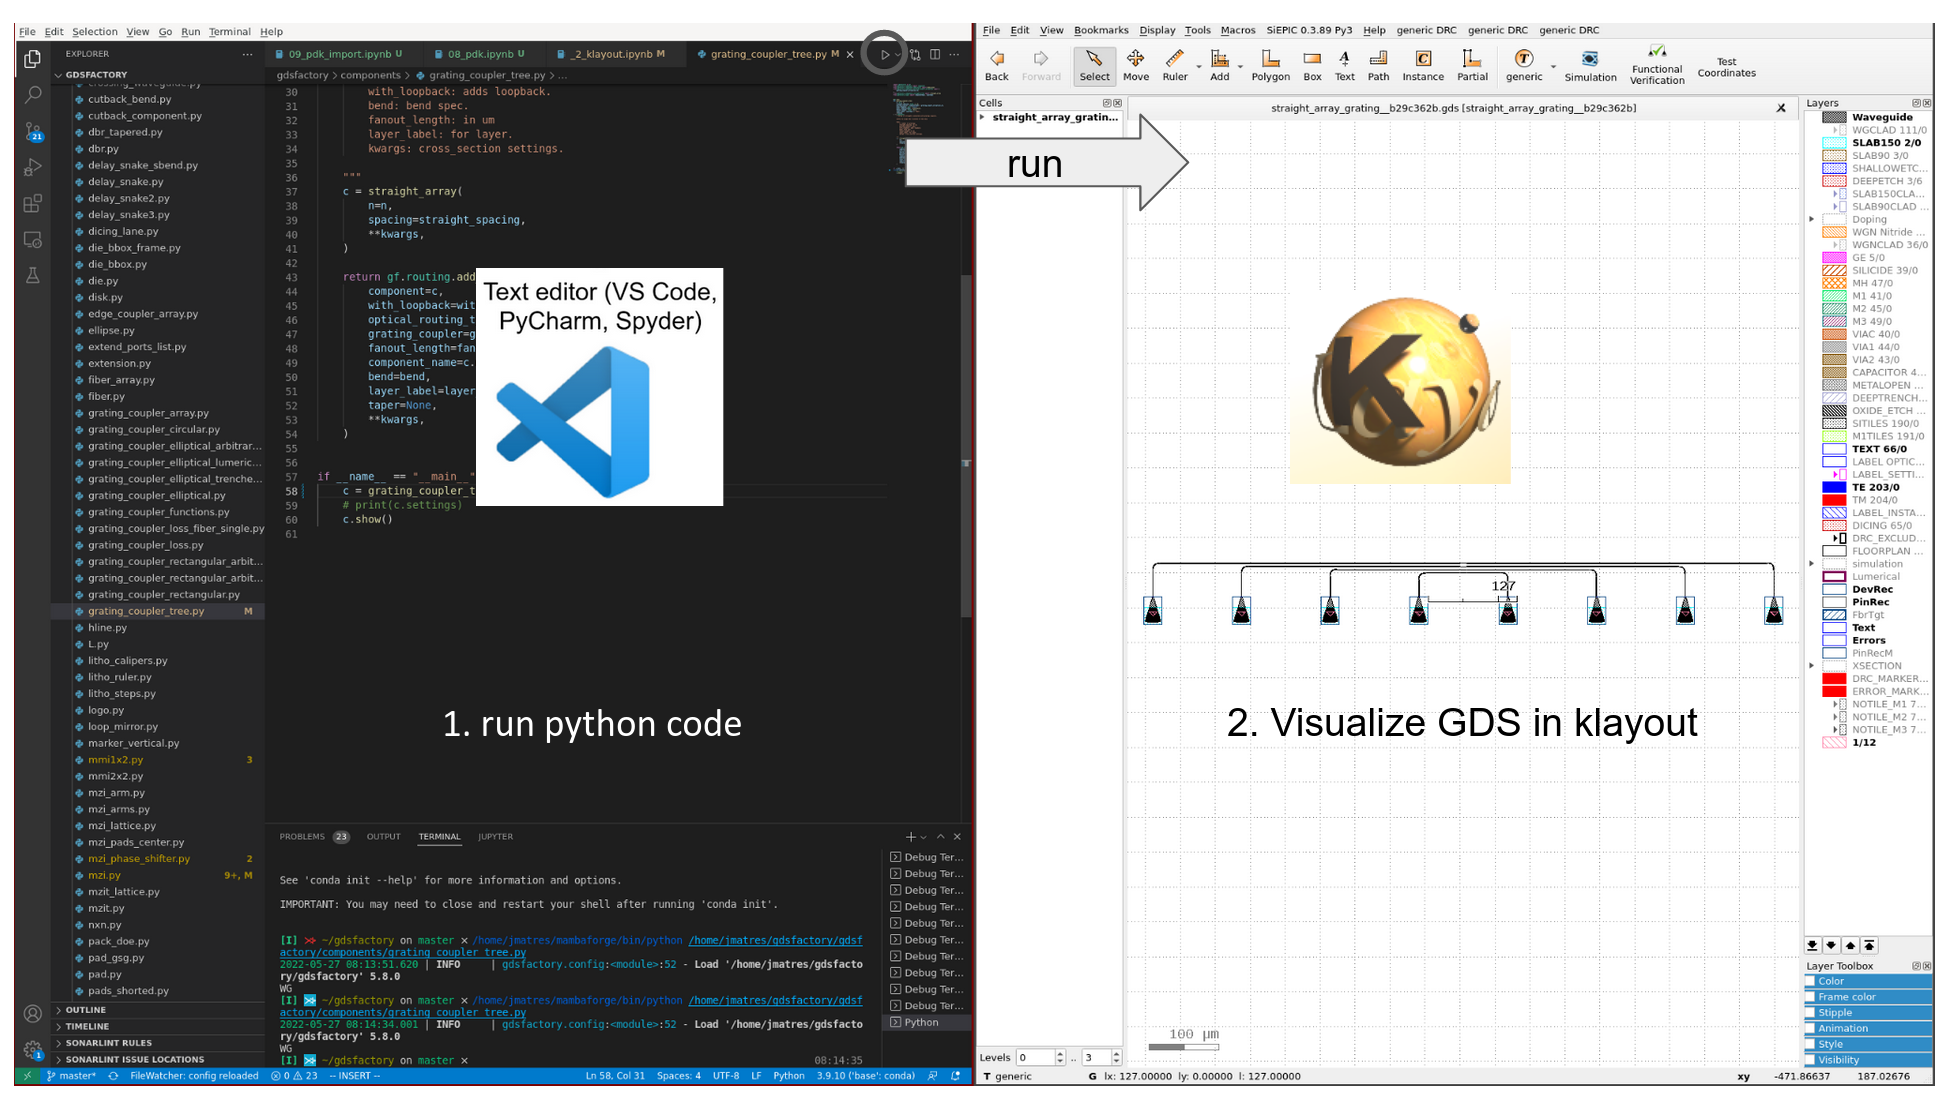
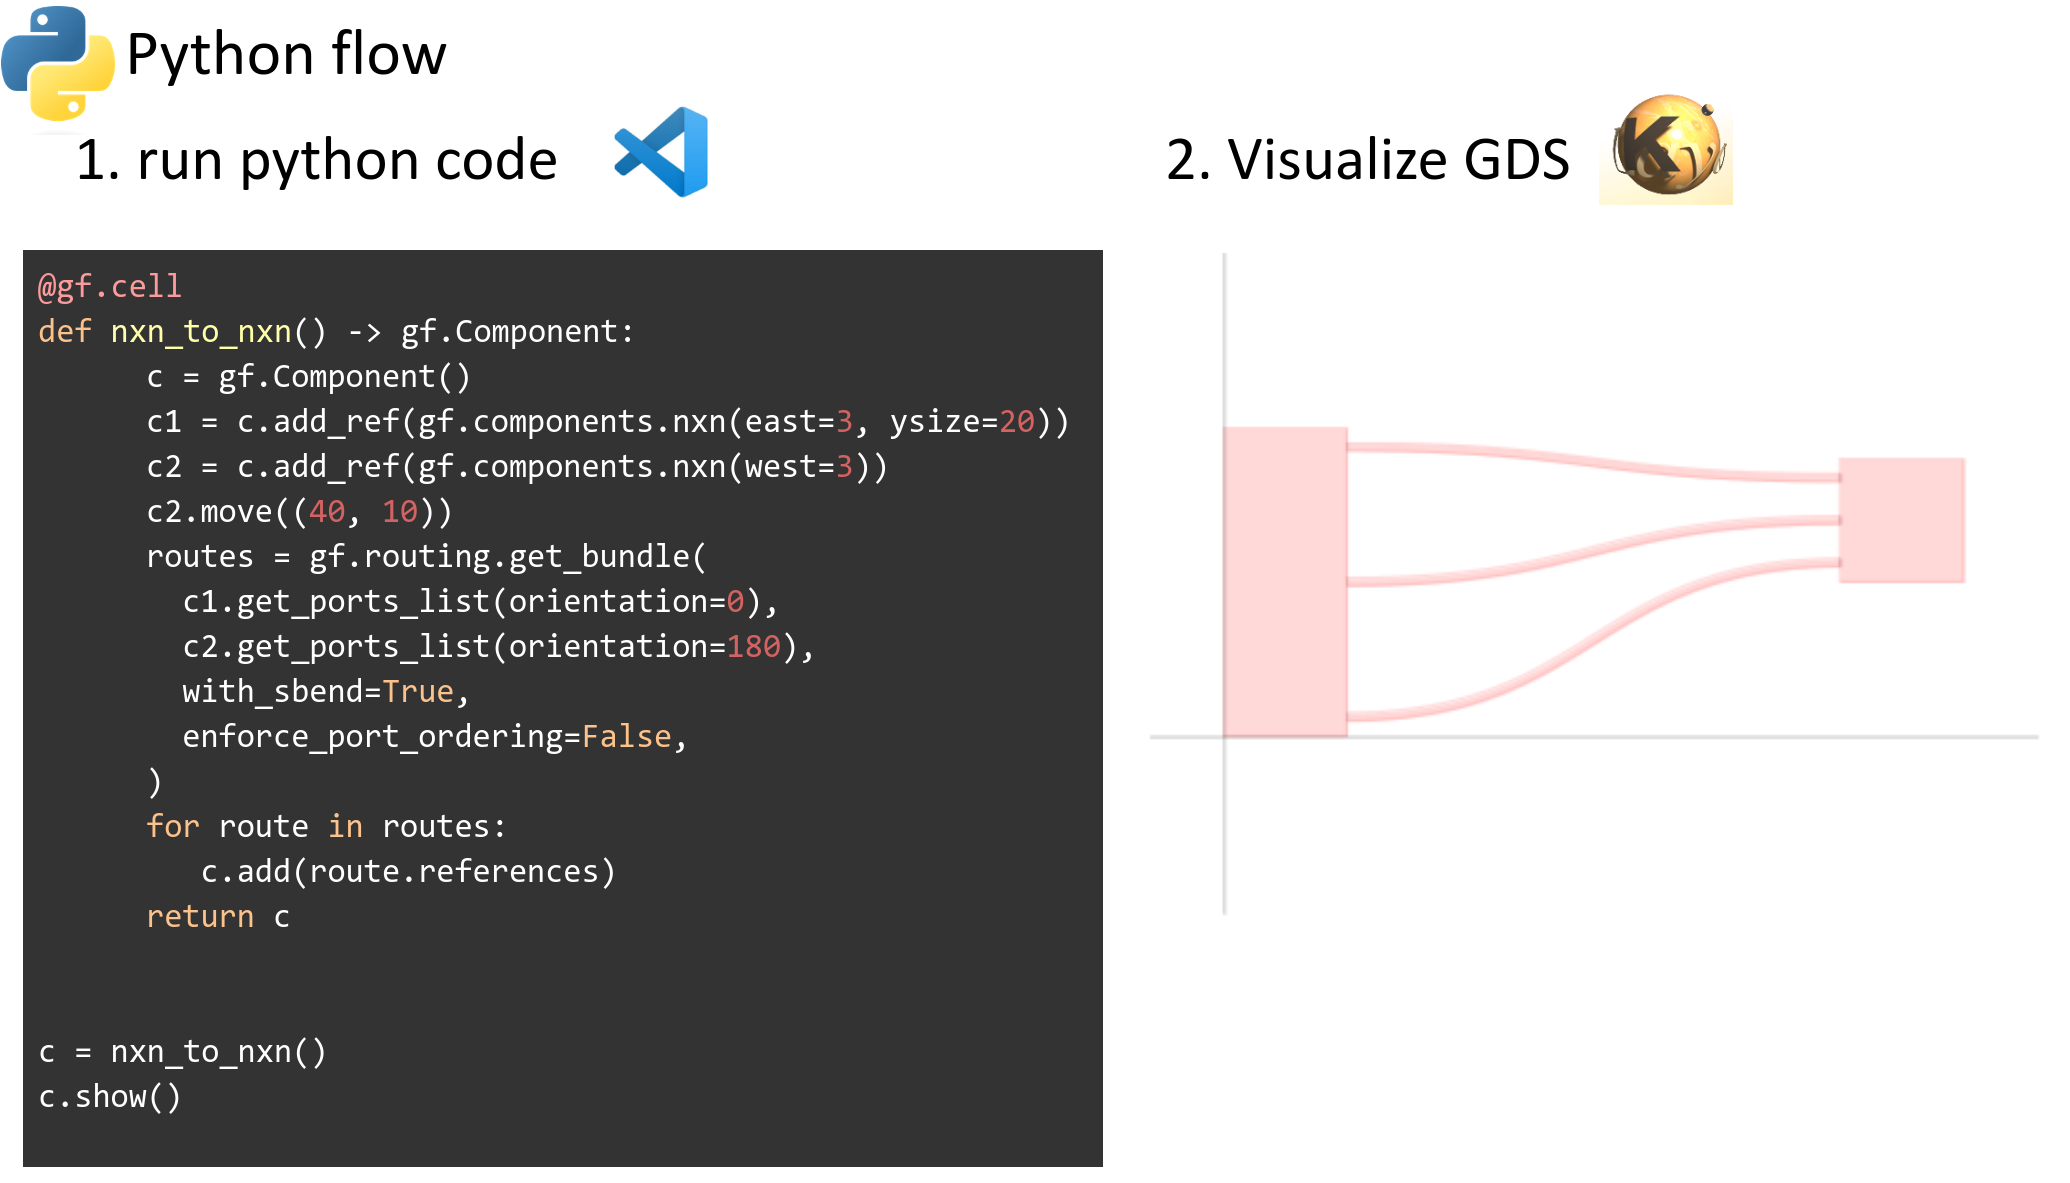
1. Standard Python flow#
You write your PCells in python.
You execute the python code.
You visualize the GDS Layout in Klayout, or run simulations using the plugin extensions directly from the layout (for devices) or netlist (from circuits).
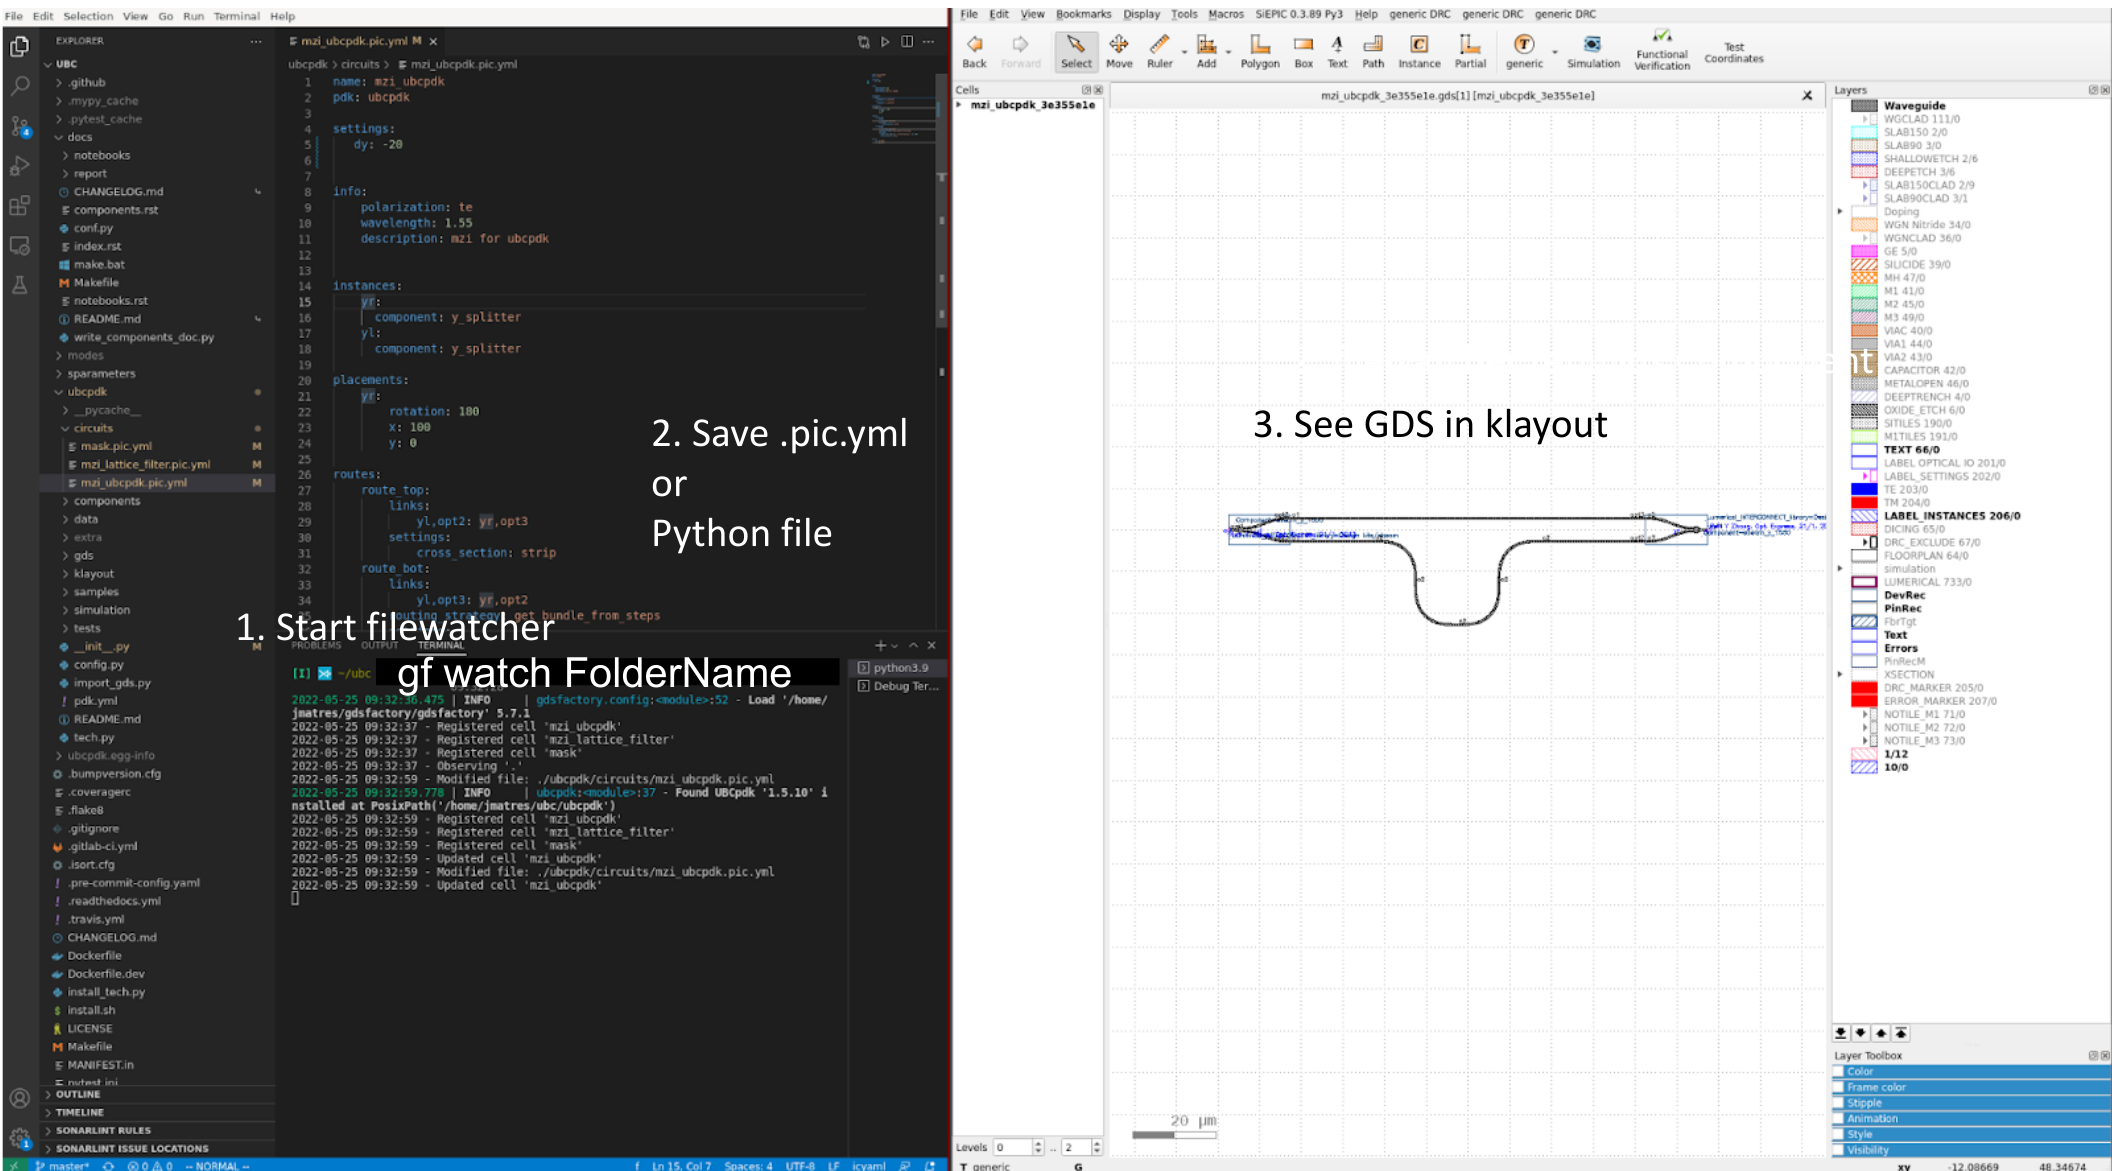
2. File-watcher flow#
For building large components can use a file-watcher and see your updates in KLayout every time you save.
You execute the file watcher run this command on your terminal
gf watch --path /home/jmatres/my_chipsfor watchingmy_chipsfolder or run it in the current working directorygf watch --path .The file-watcher re-runs any python file
.pyor YAML.pic.yml. For testing it you can go togdsfactory/samples/demo/circuits, modify any of the files and take a look how klayout updates every time you save a file.Thanks to the
cellcache you can see your new component changes live updating the layout in Klayout.
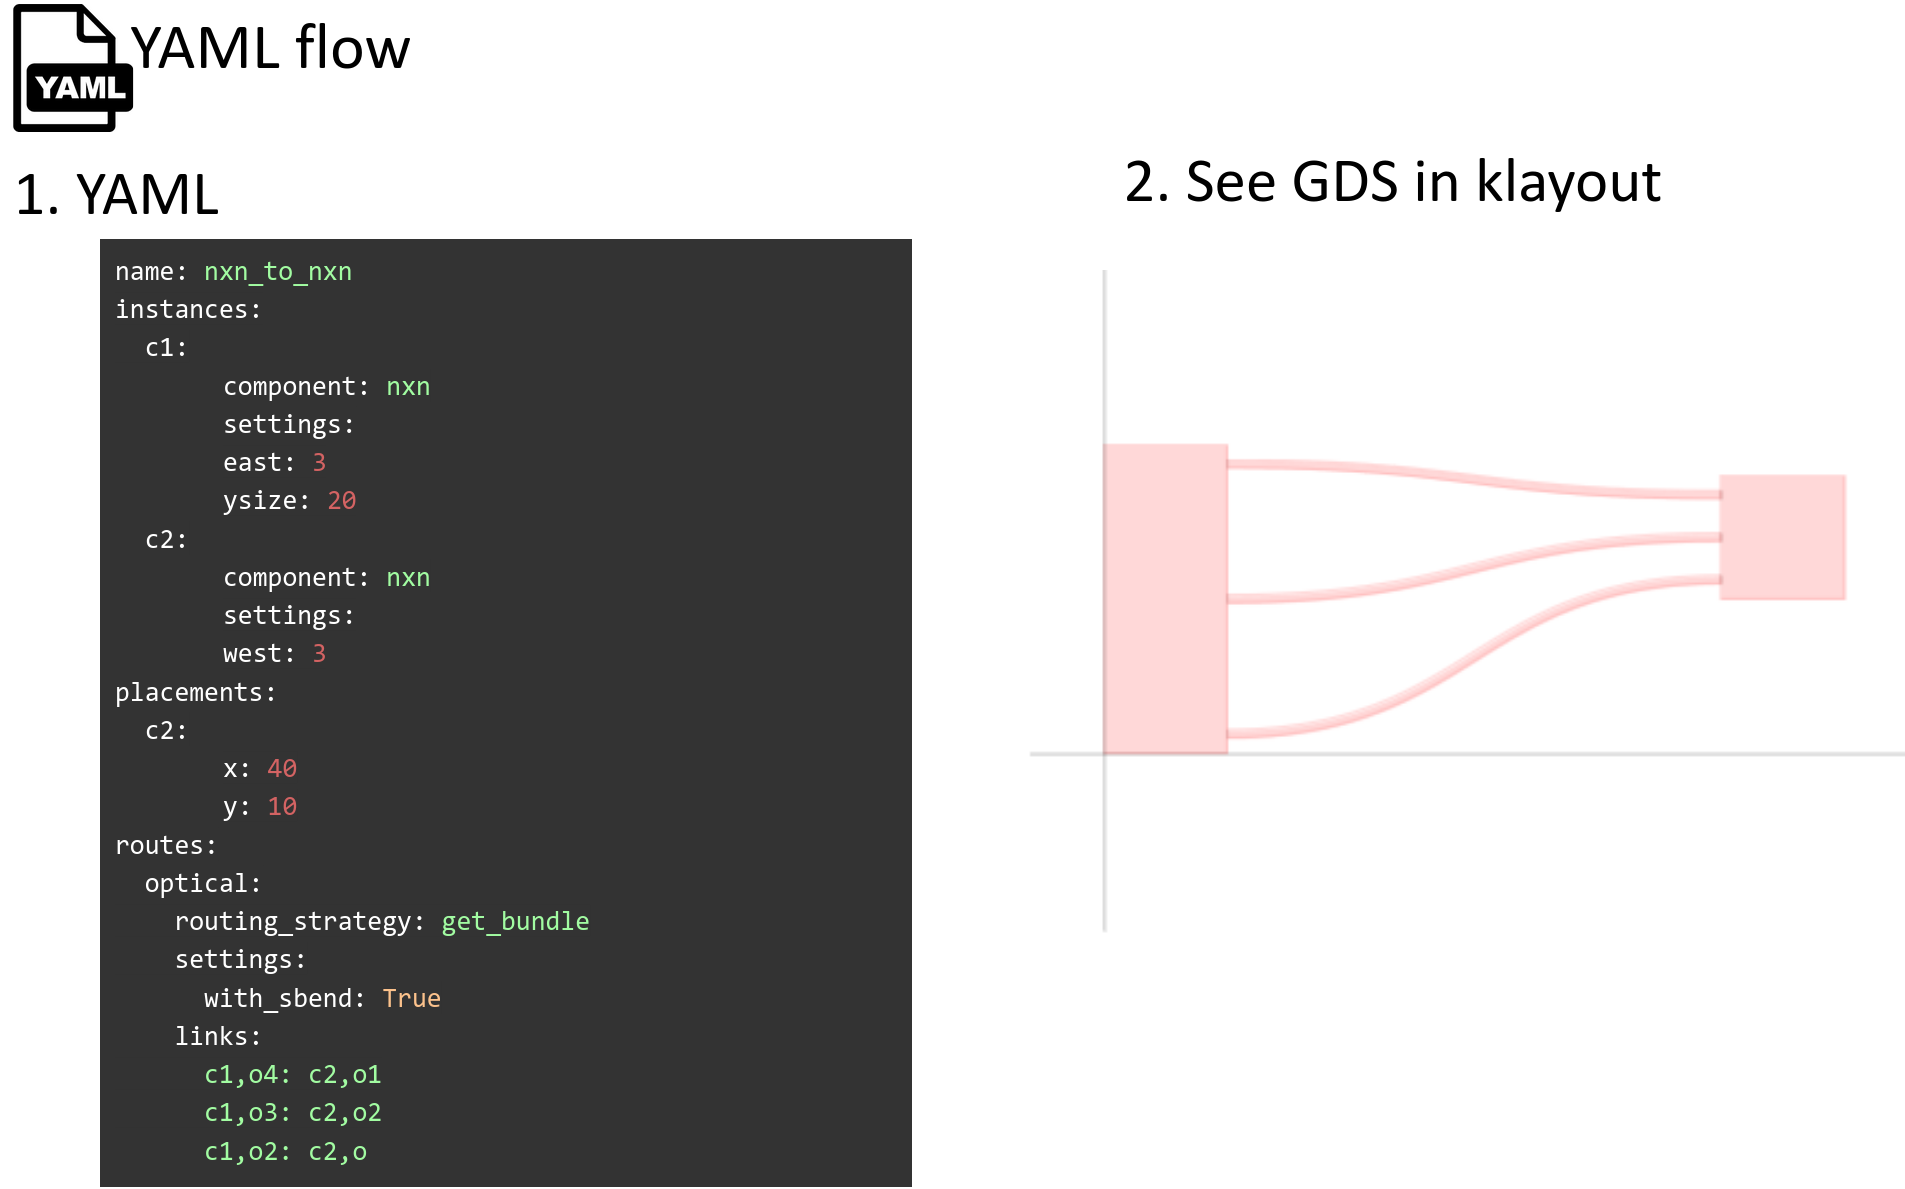
The file watcher works with python or pic.yml
or YAML
3. Schematic driven layout#
For Schematic-Driven Layout, we highly recommend using GDSFactory+ for a seamless and efficient design experience.
4. AI Agent workflow#
You can use AI agents (like Gemini CLI or Claude Code) to autonomously generate and iterate on component designs.
The gdsfactory-component-designer Agent Skill enables agents to:
Generate components from the built-in library or activated PDKs.
Visualize layouts and import images directly into the conversation context.
Iterate on designs by tweaking parameters based on visual feedback.
See the .agents/skills/ directory for more information on using Agent Skills.